Dagit UI#
Dagit is a web-based interface for viewing and interacting with Dagster objects.
You can inspect op, job, and graph definitions, launch runs, view launched runs, and view assets produced by those runs.
To launch the Dagit web server, run dagit. The command will print out the URL you can access the interface from in the browser, usually on port 3000.
Dagit fetches definitions - jobs, ops, schedules, sensors - from a set of repositories configured in workspace.yaml. It fetches runs and assets from storage, configured in an instance's dagster.yaml.
These are the main pages inside Dagit:
Job#
The Job page offers tools to explore a job definition and launch runs for that job.
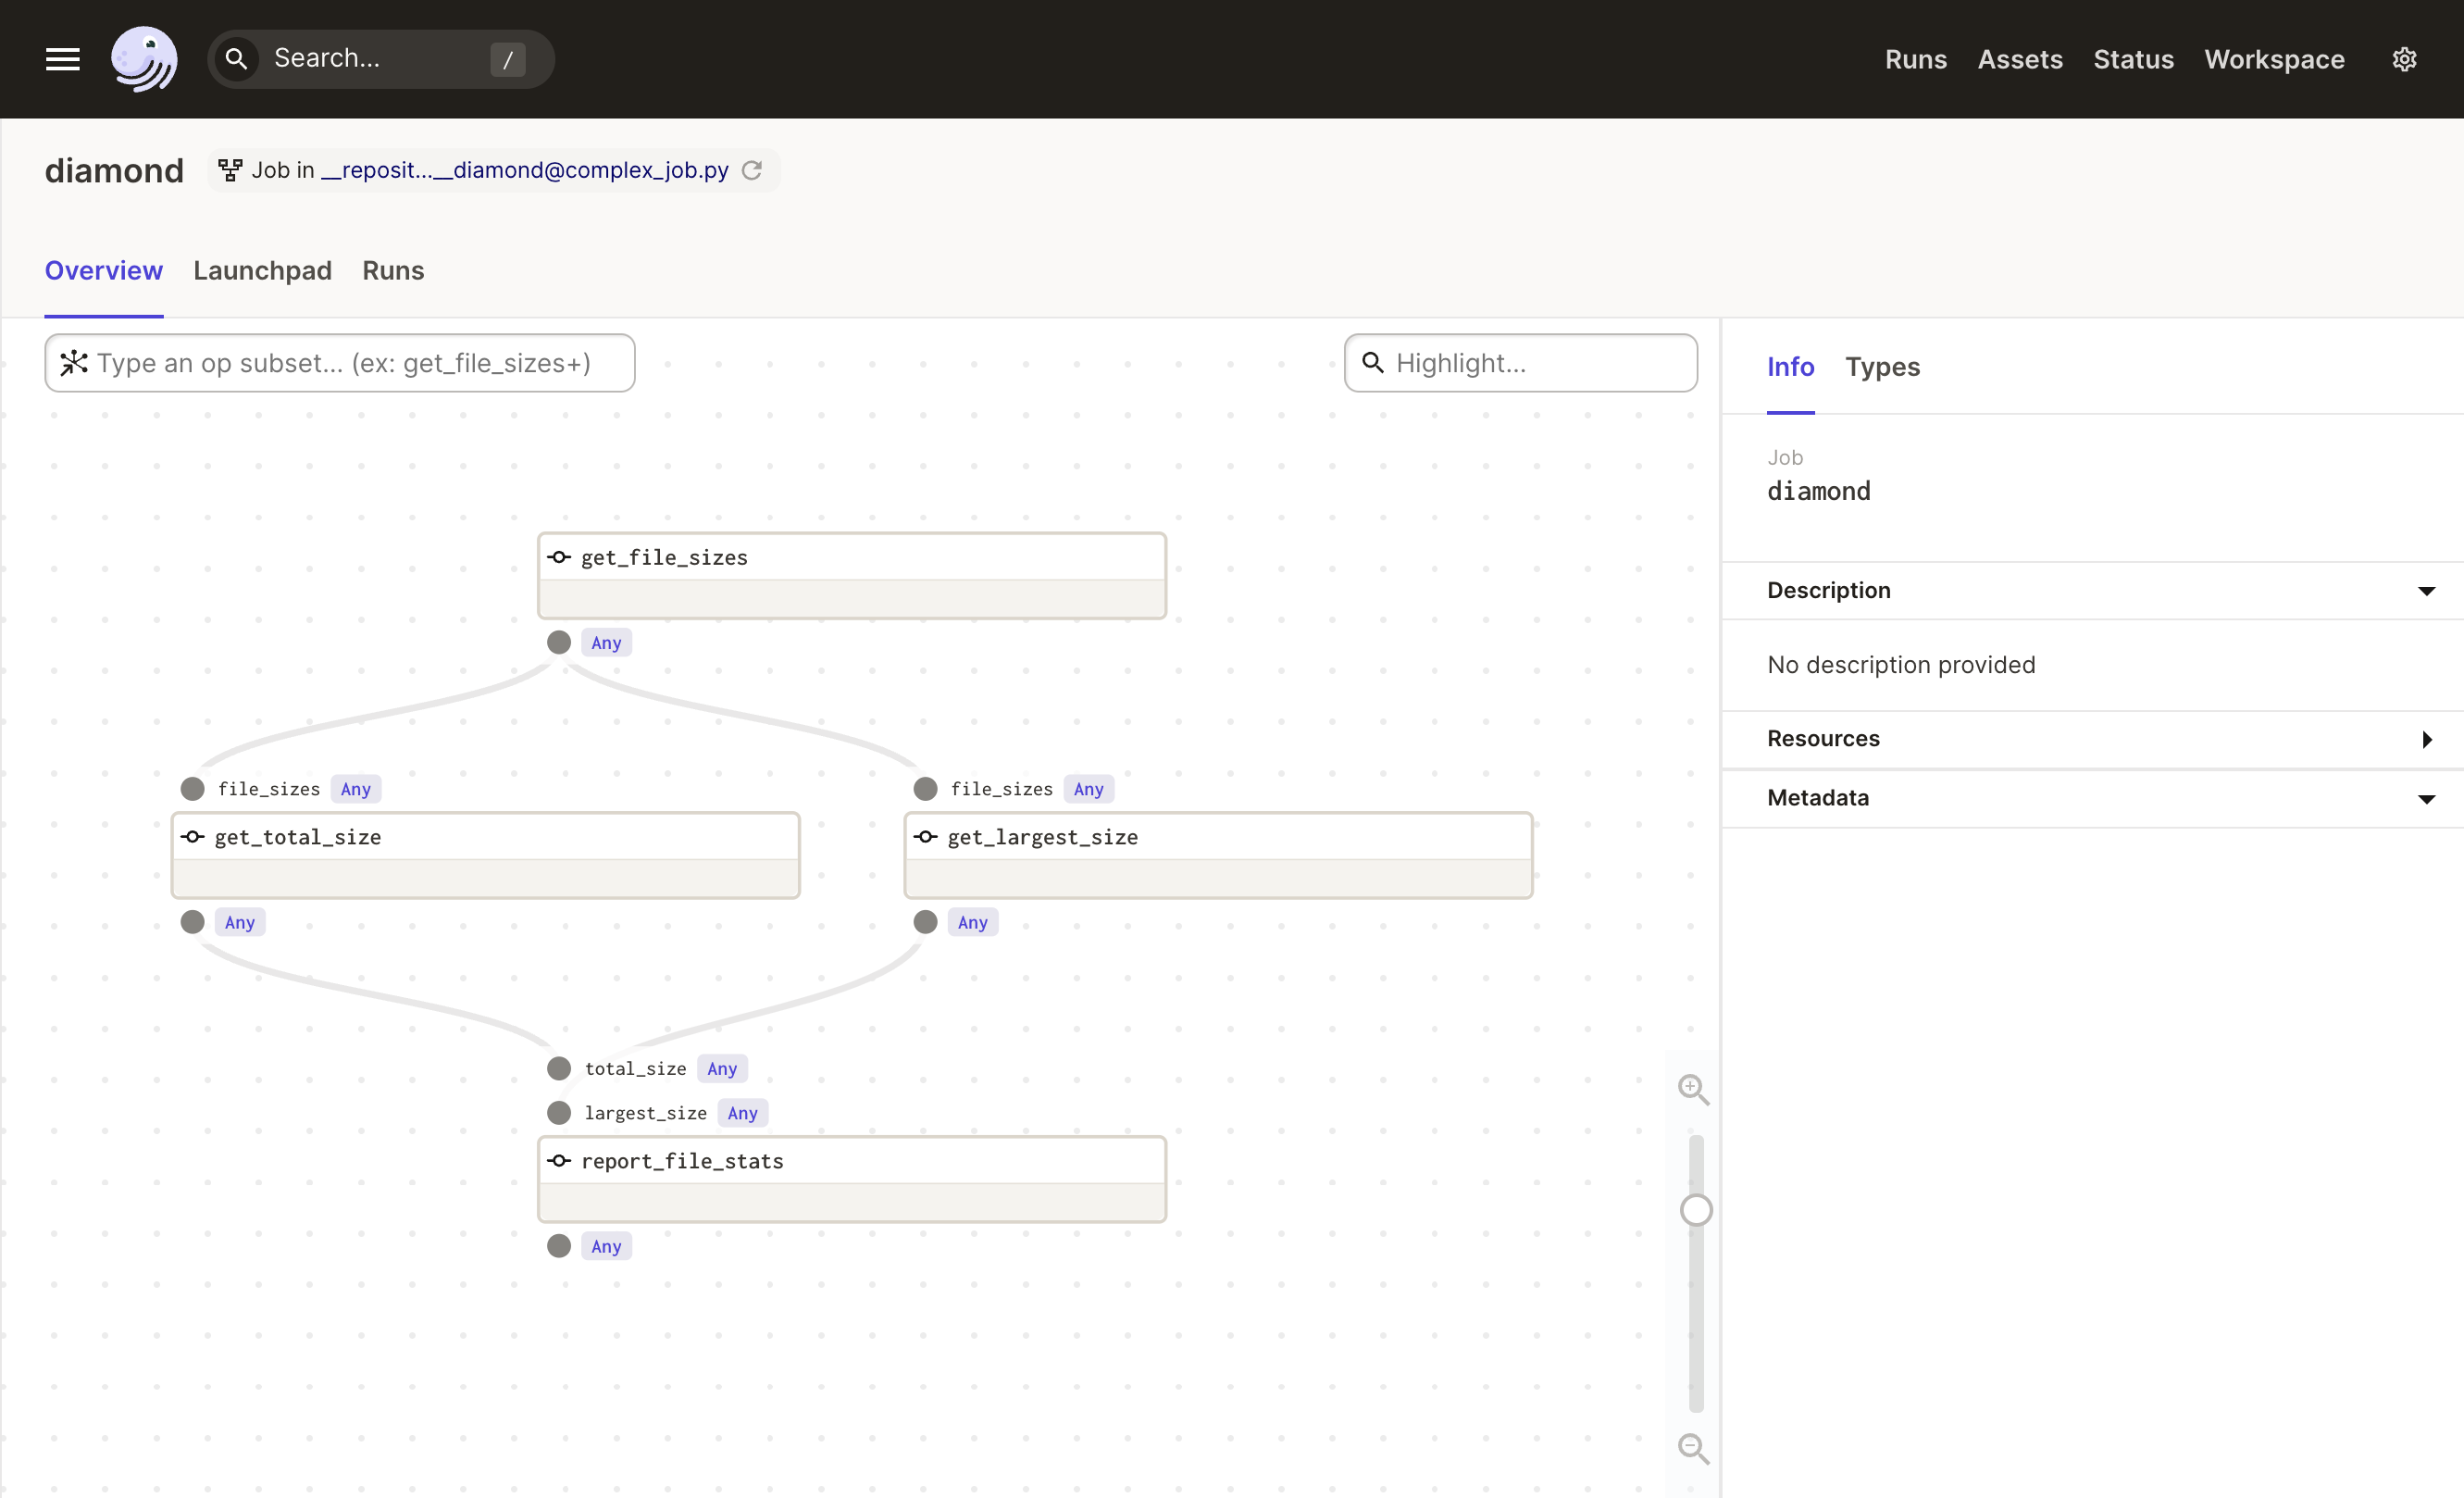
Job Definition#
The Overview tab shows the graph of ops that make up a job. Selecting an op reveals detailed metadata about it in the pane to the right.

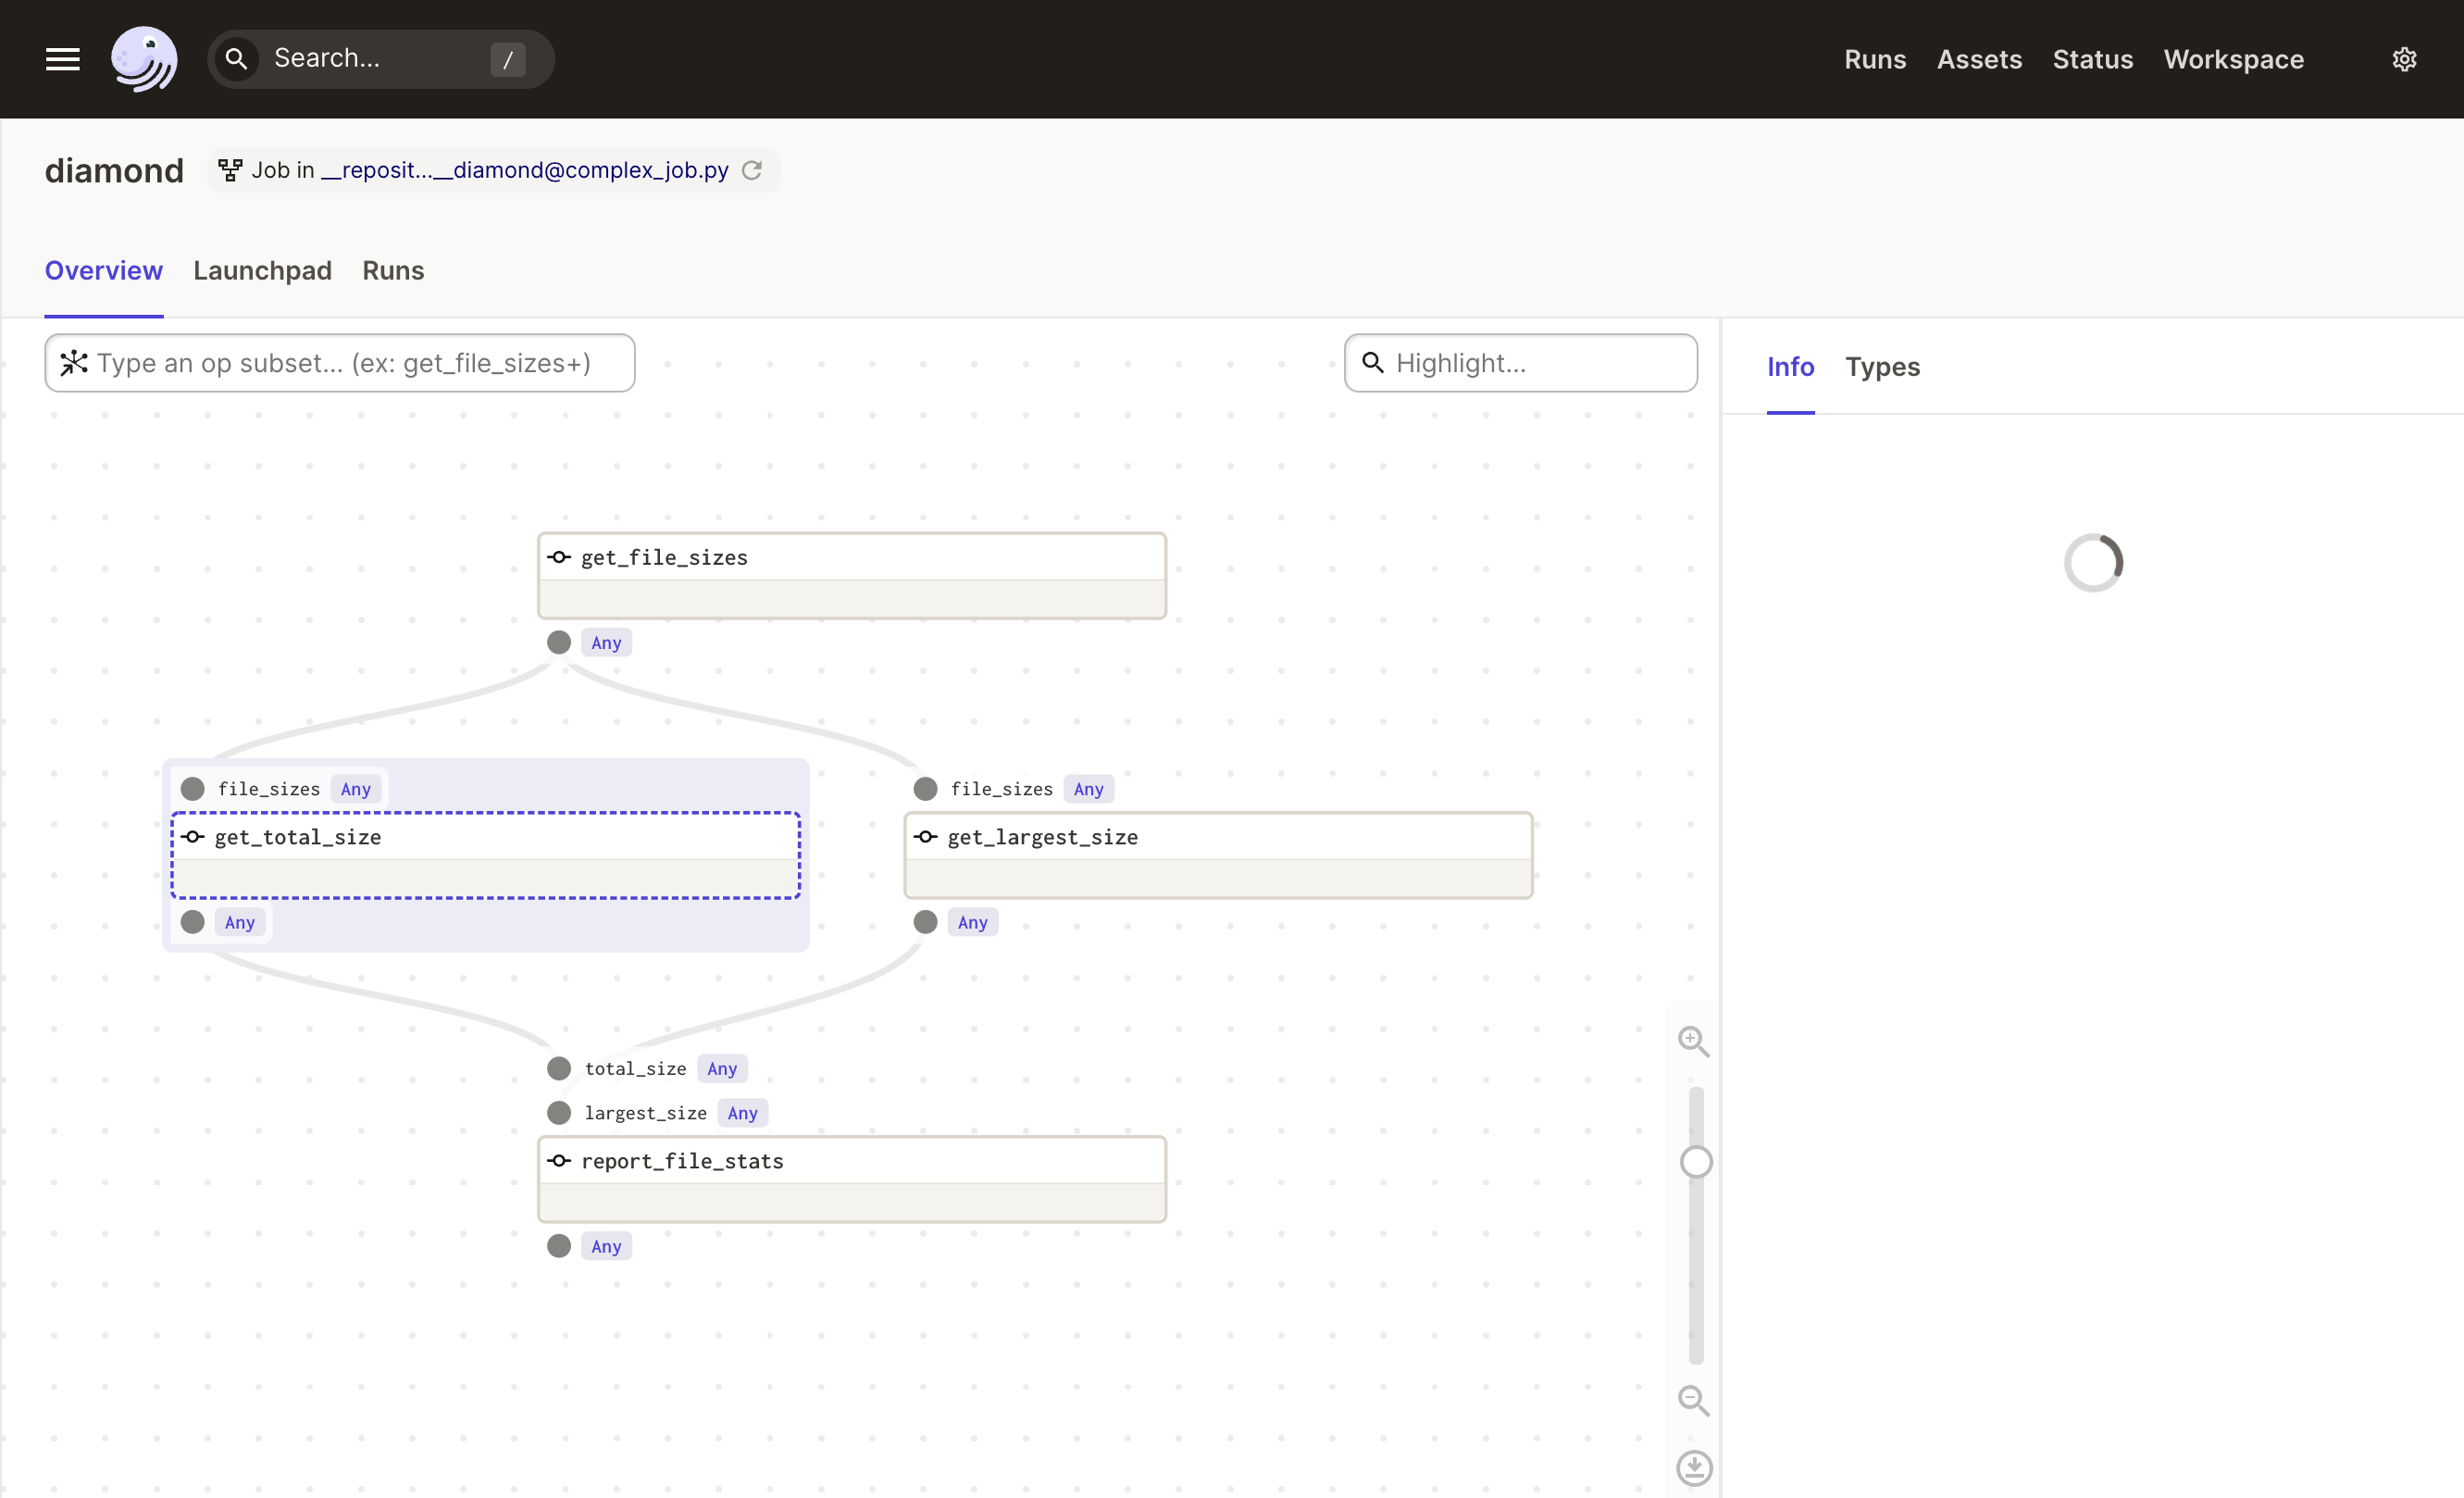
Op Definition#
On the Overview tab, clicking an op, you can find detailed information about the op definition.
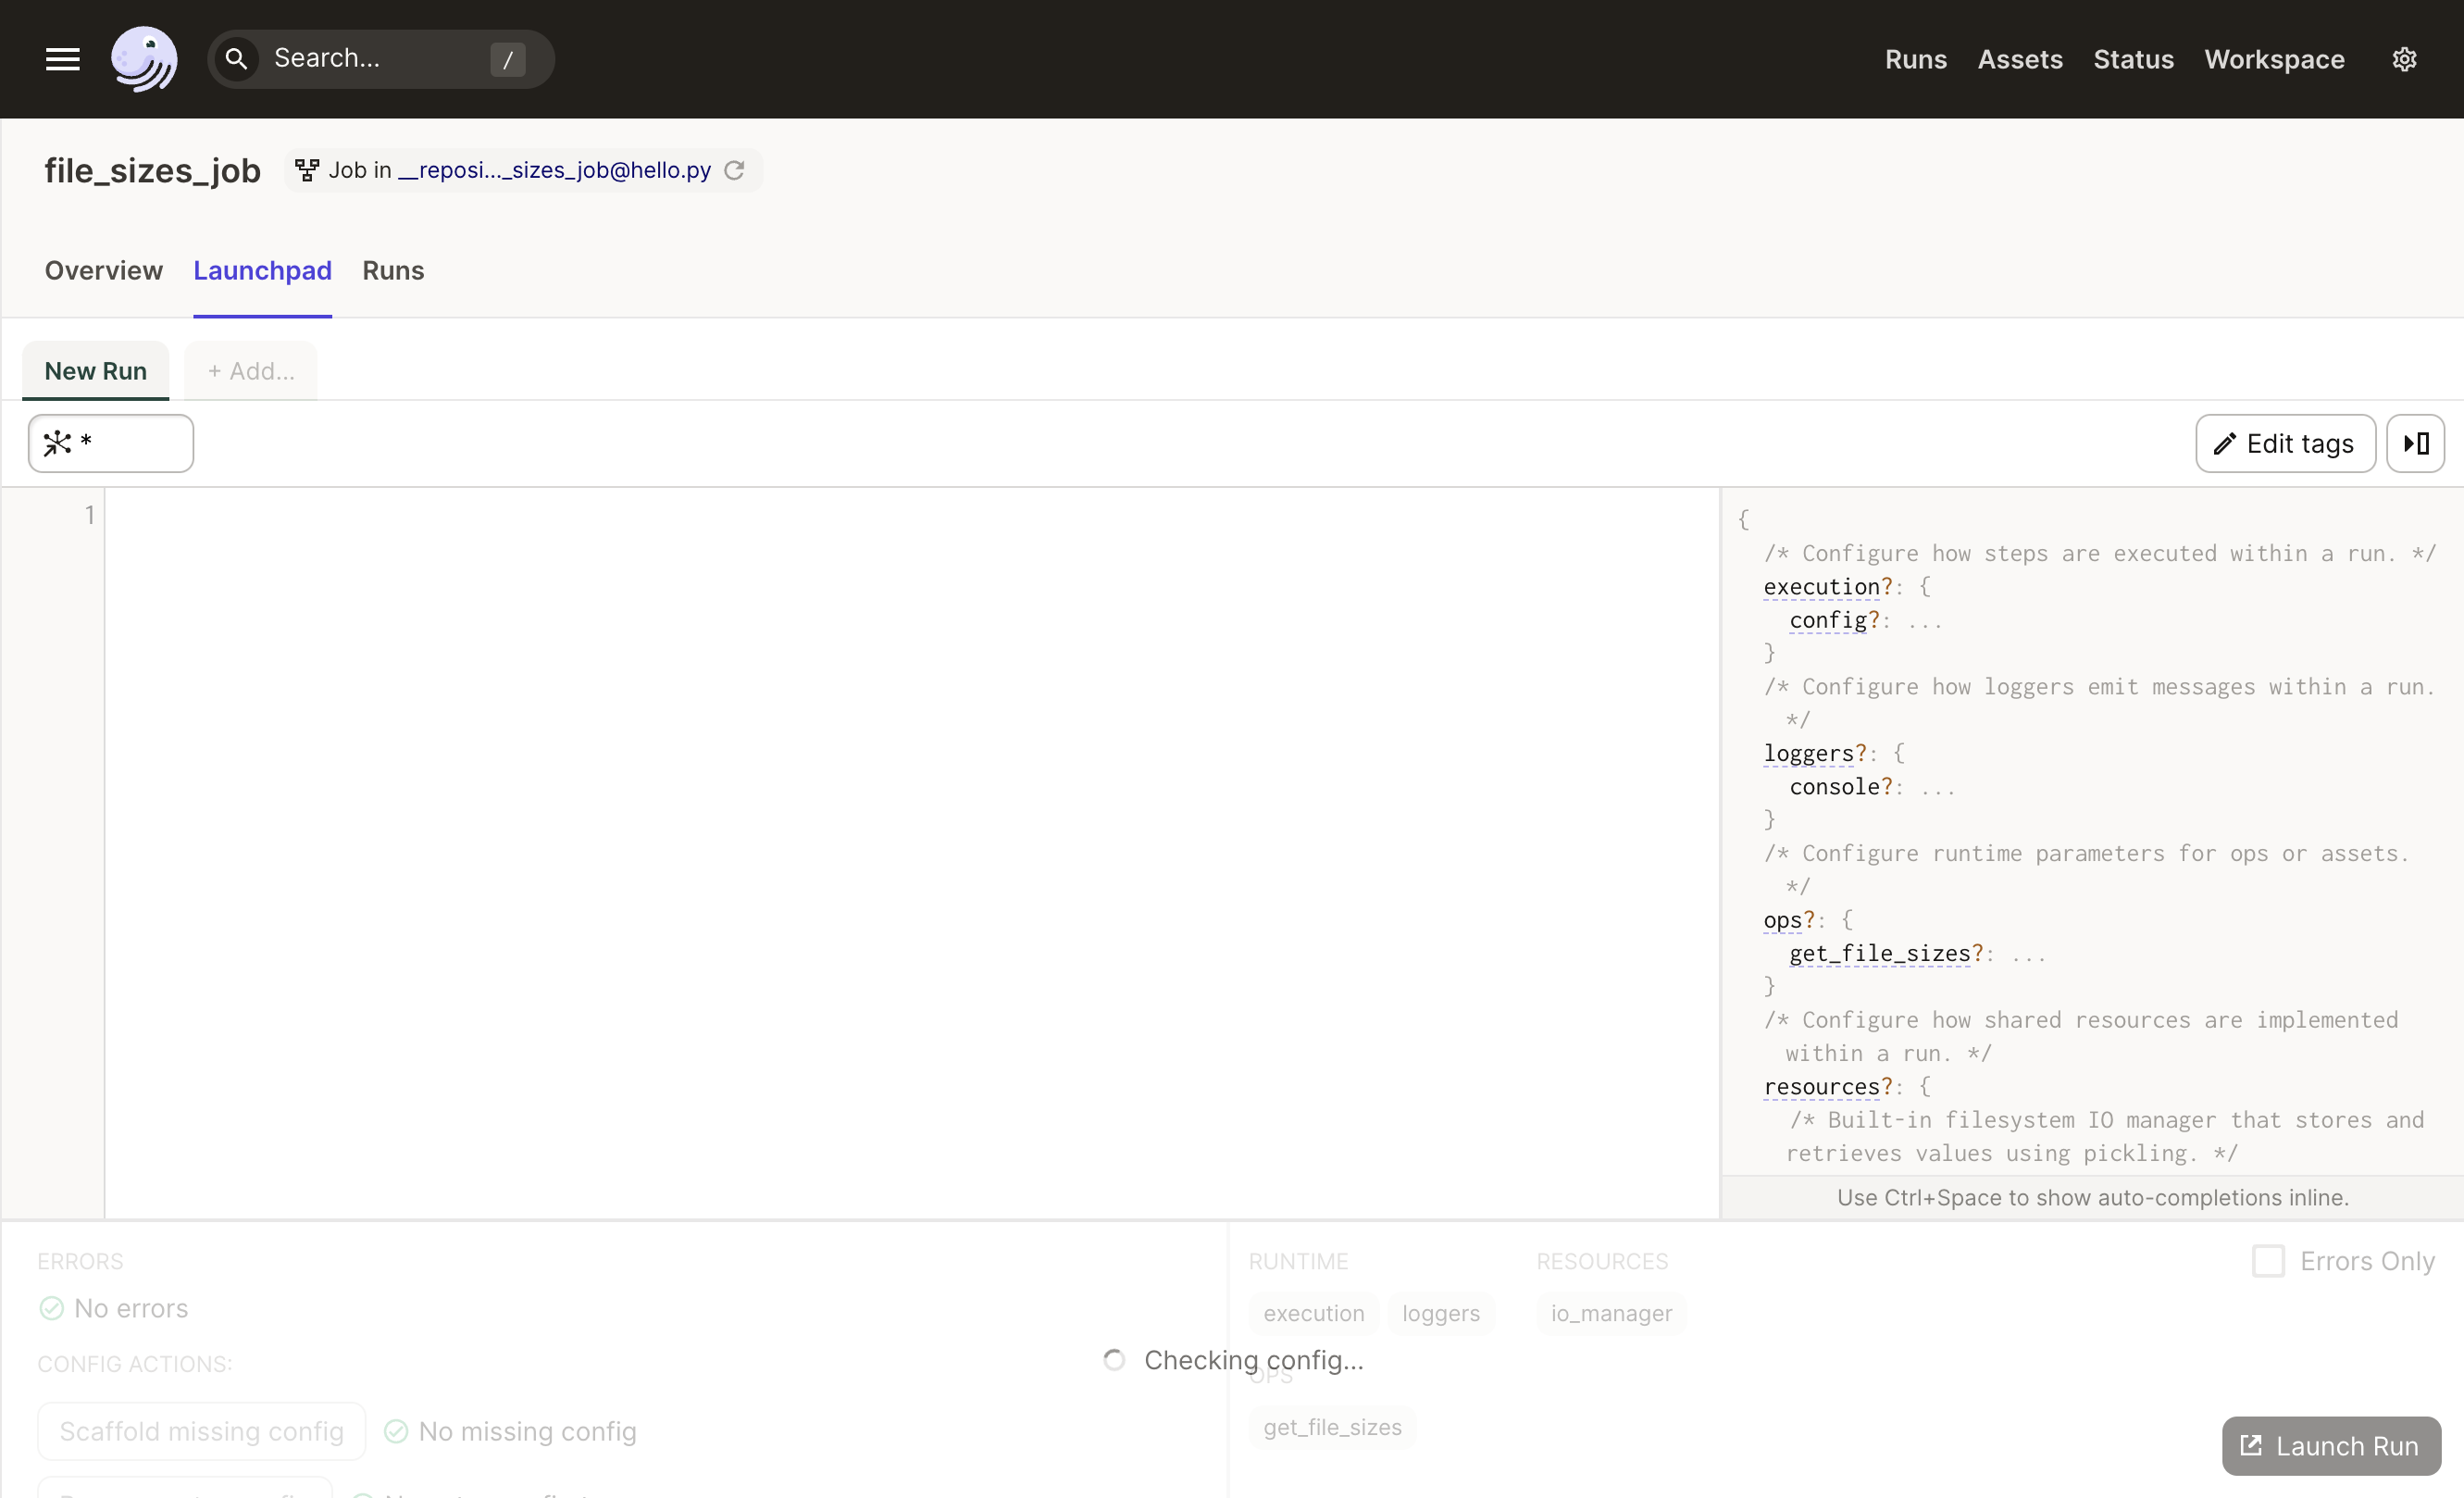
Launchpad#
The Launchpad tab provides a configuration editor to let you experiment with configuration and launch runs.
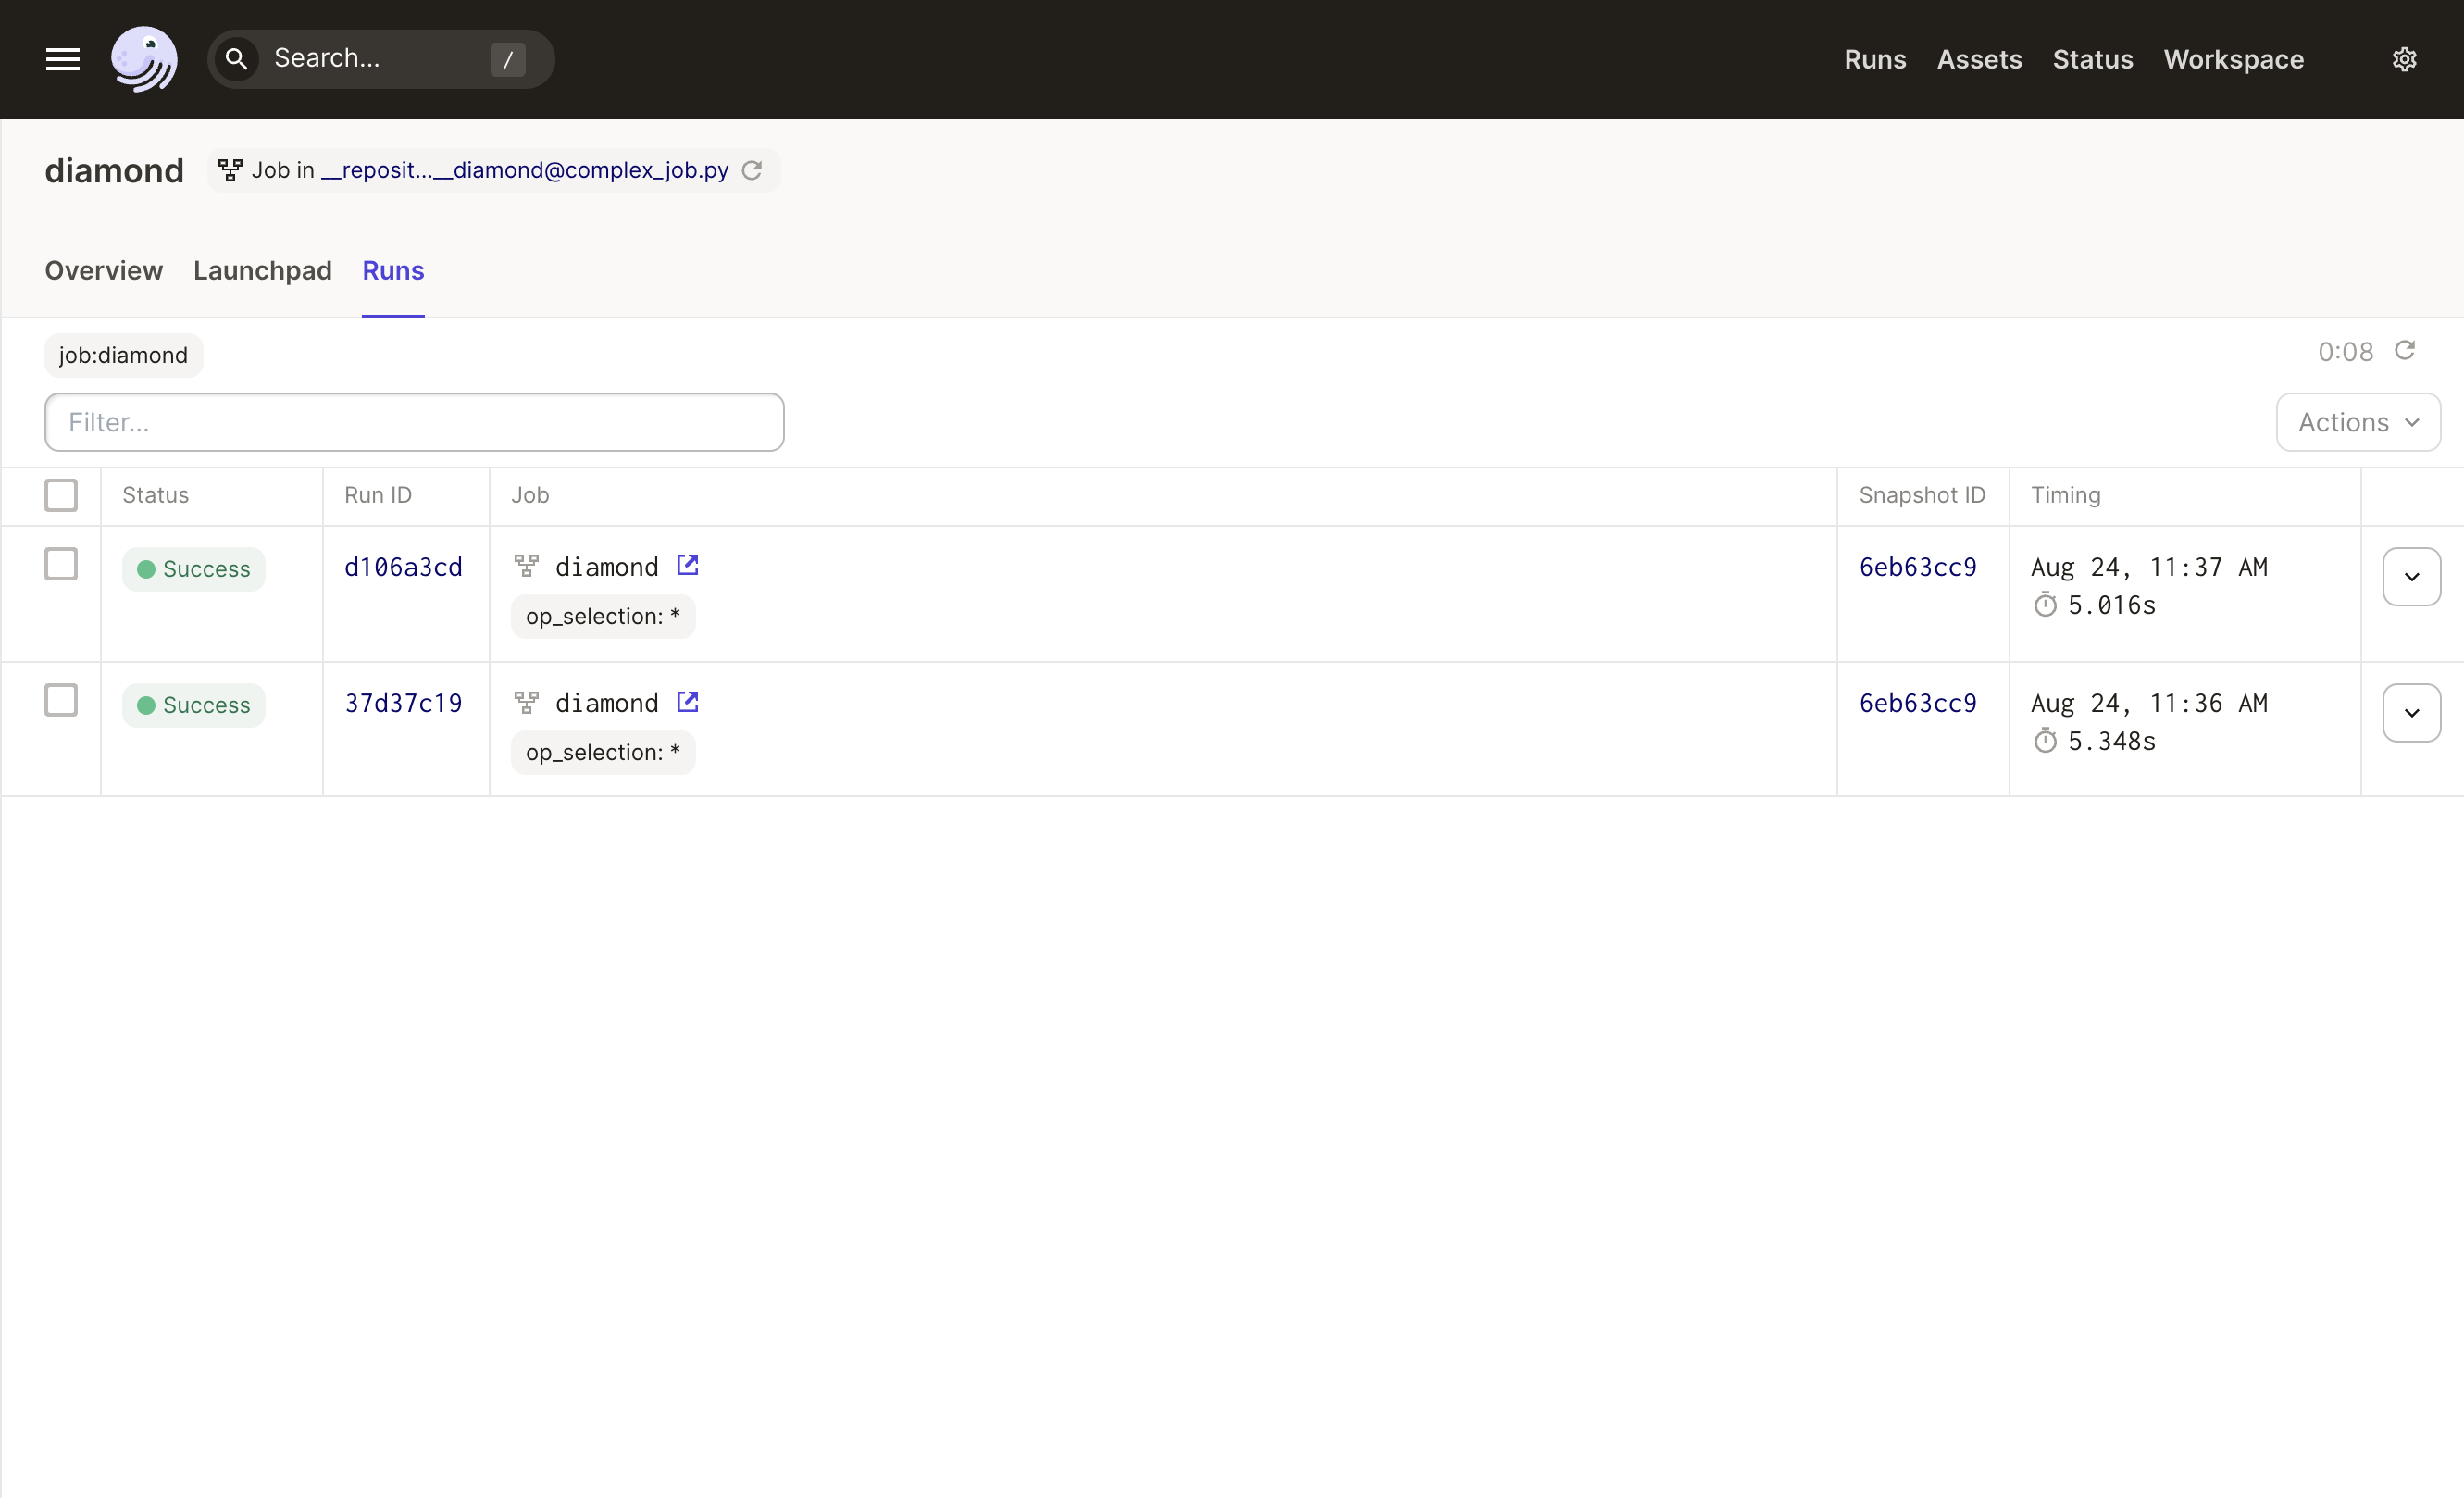
Runs Tab#
The Runs tab shows the list of recent runs for the job.
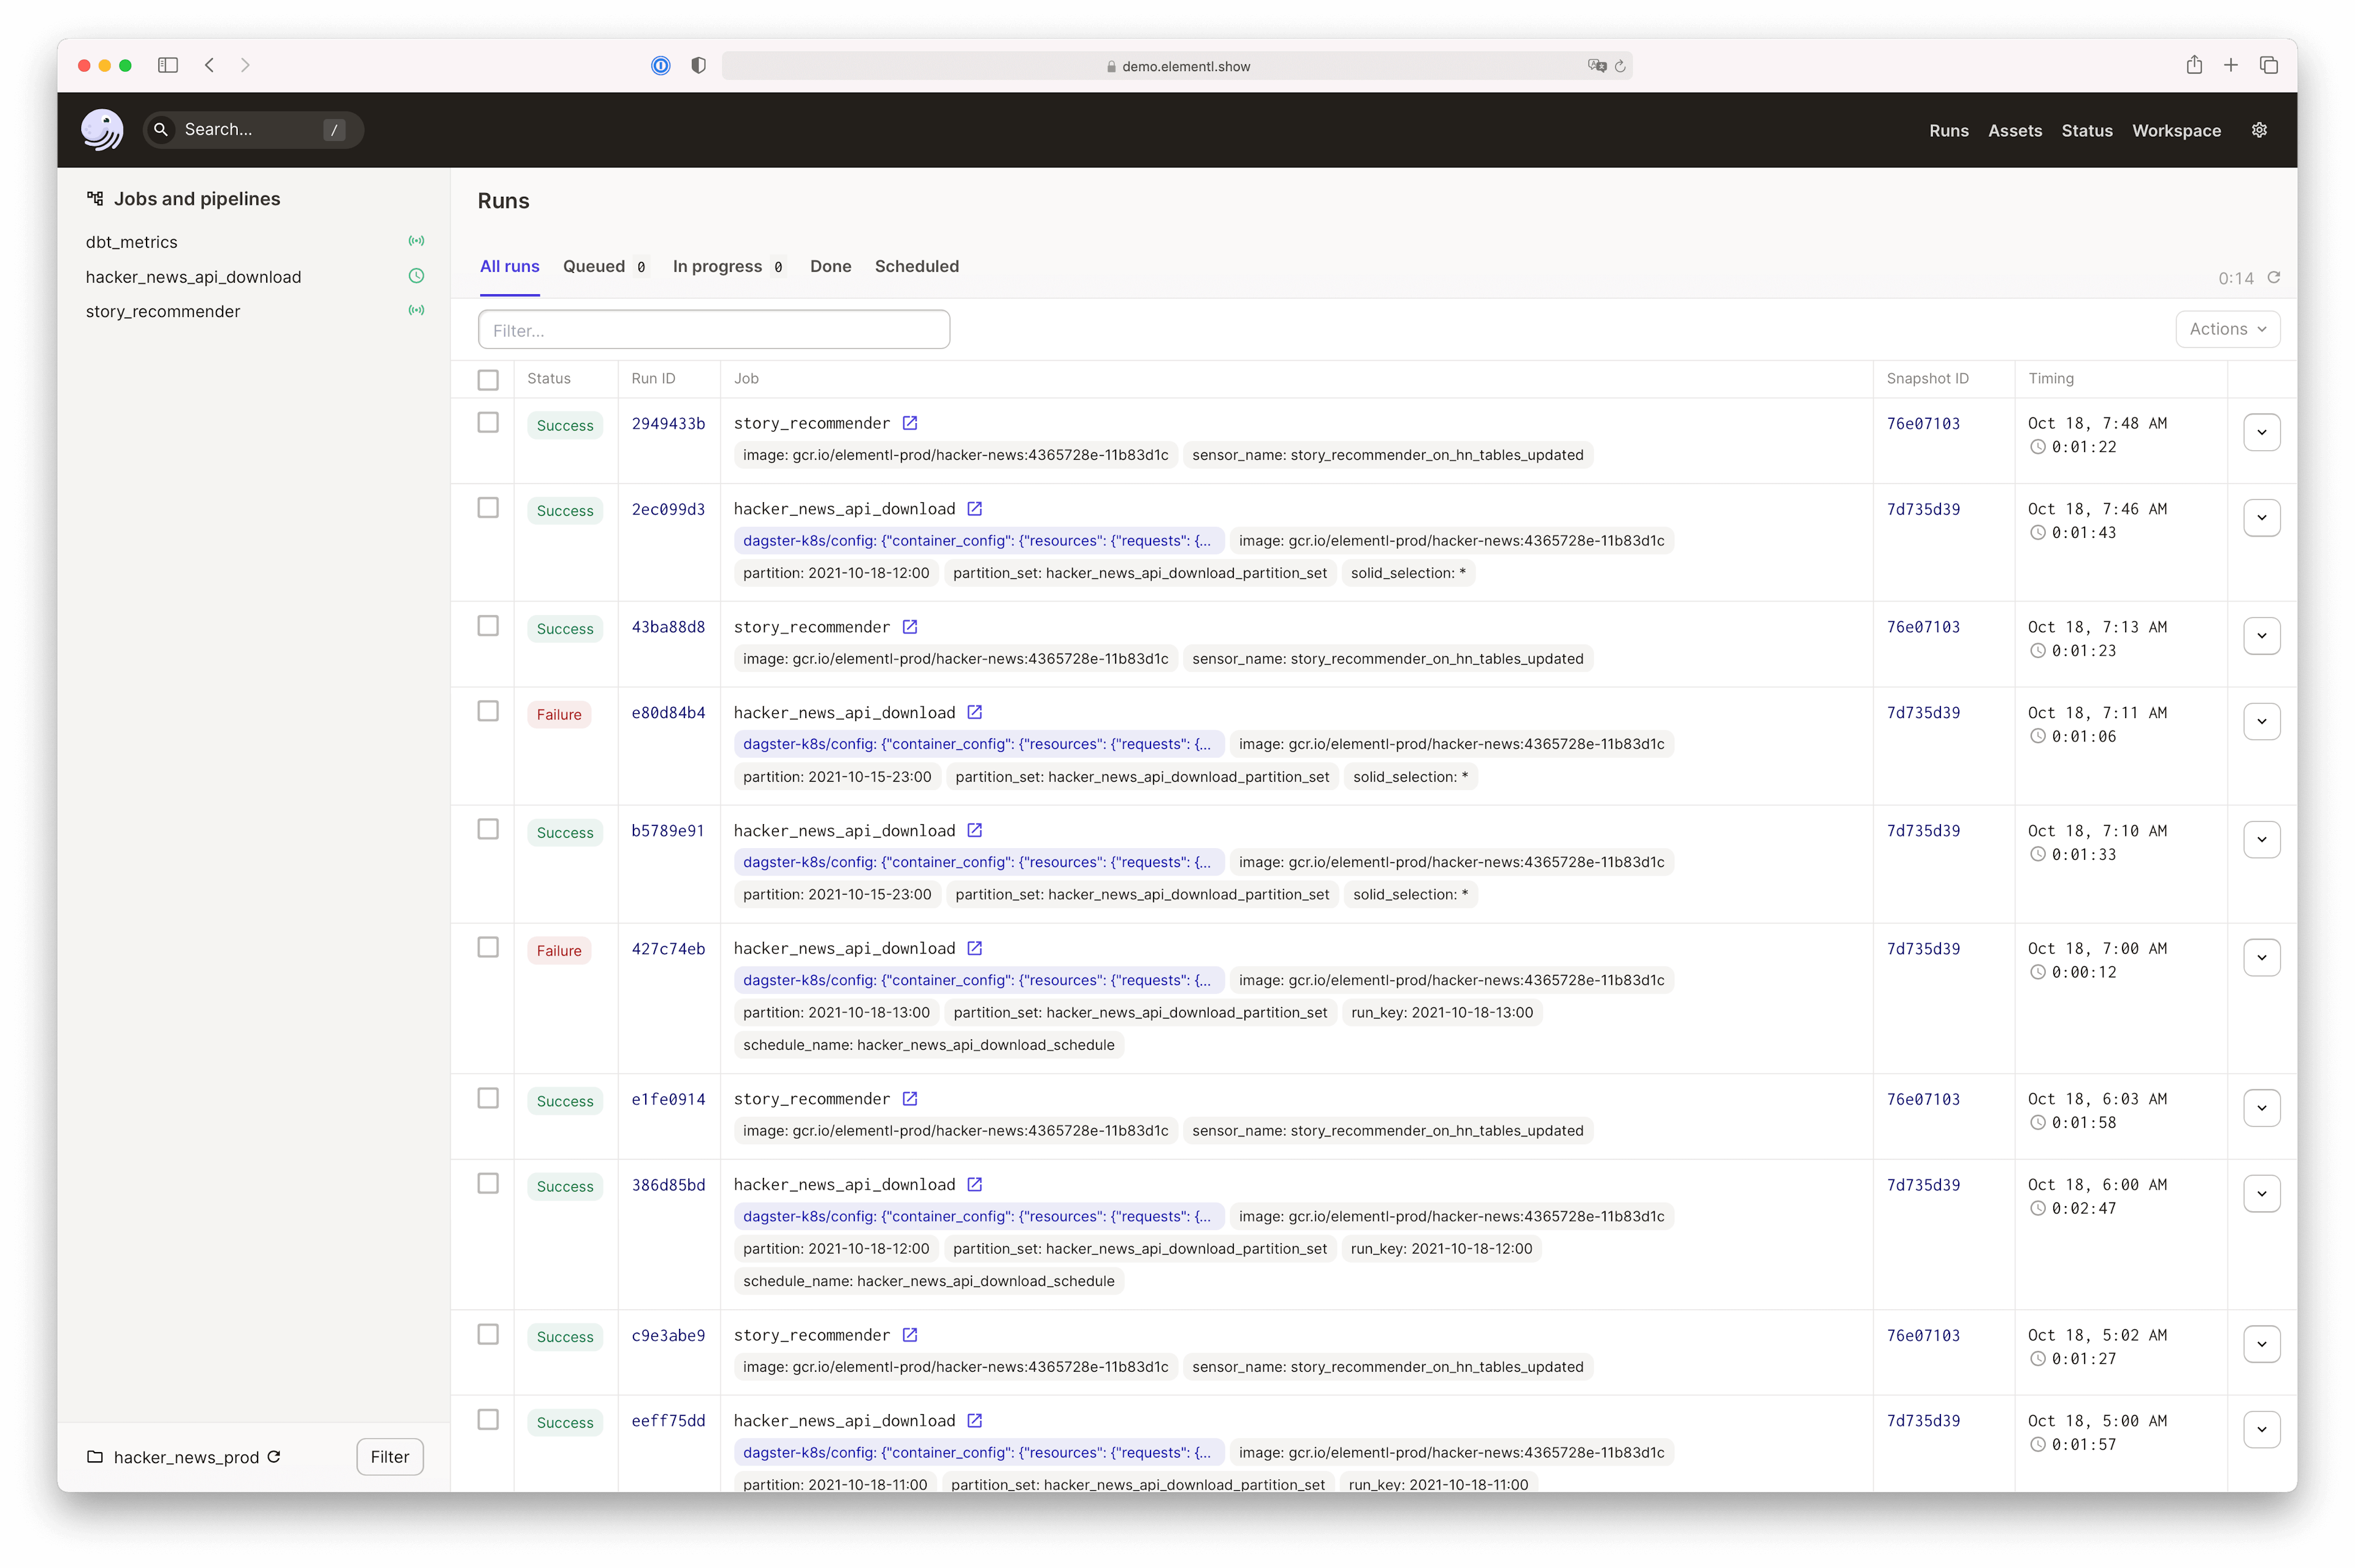
Runs#
The Runs page lists all job runs. You can filter the list by job name, run ID, execution status, or tag. Click a run ID to view details for that run.

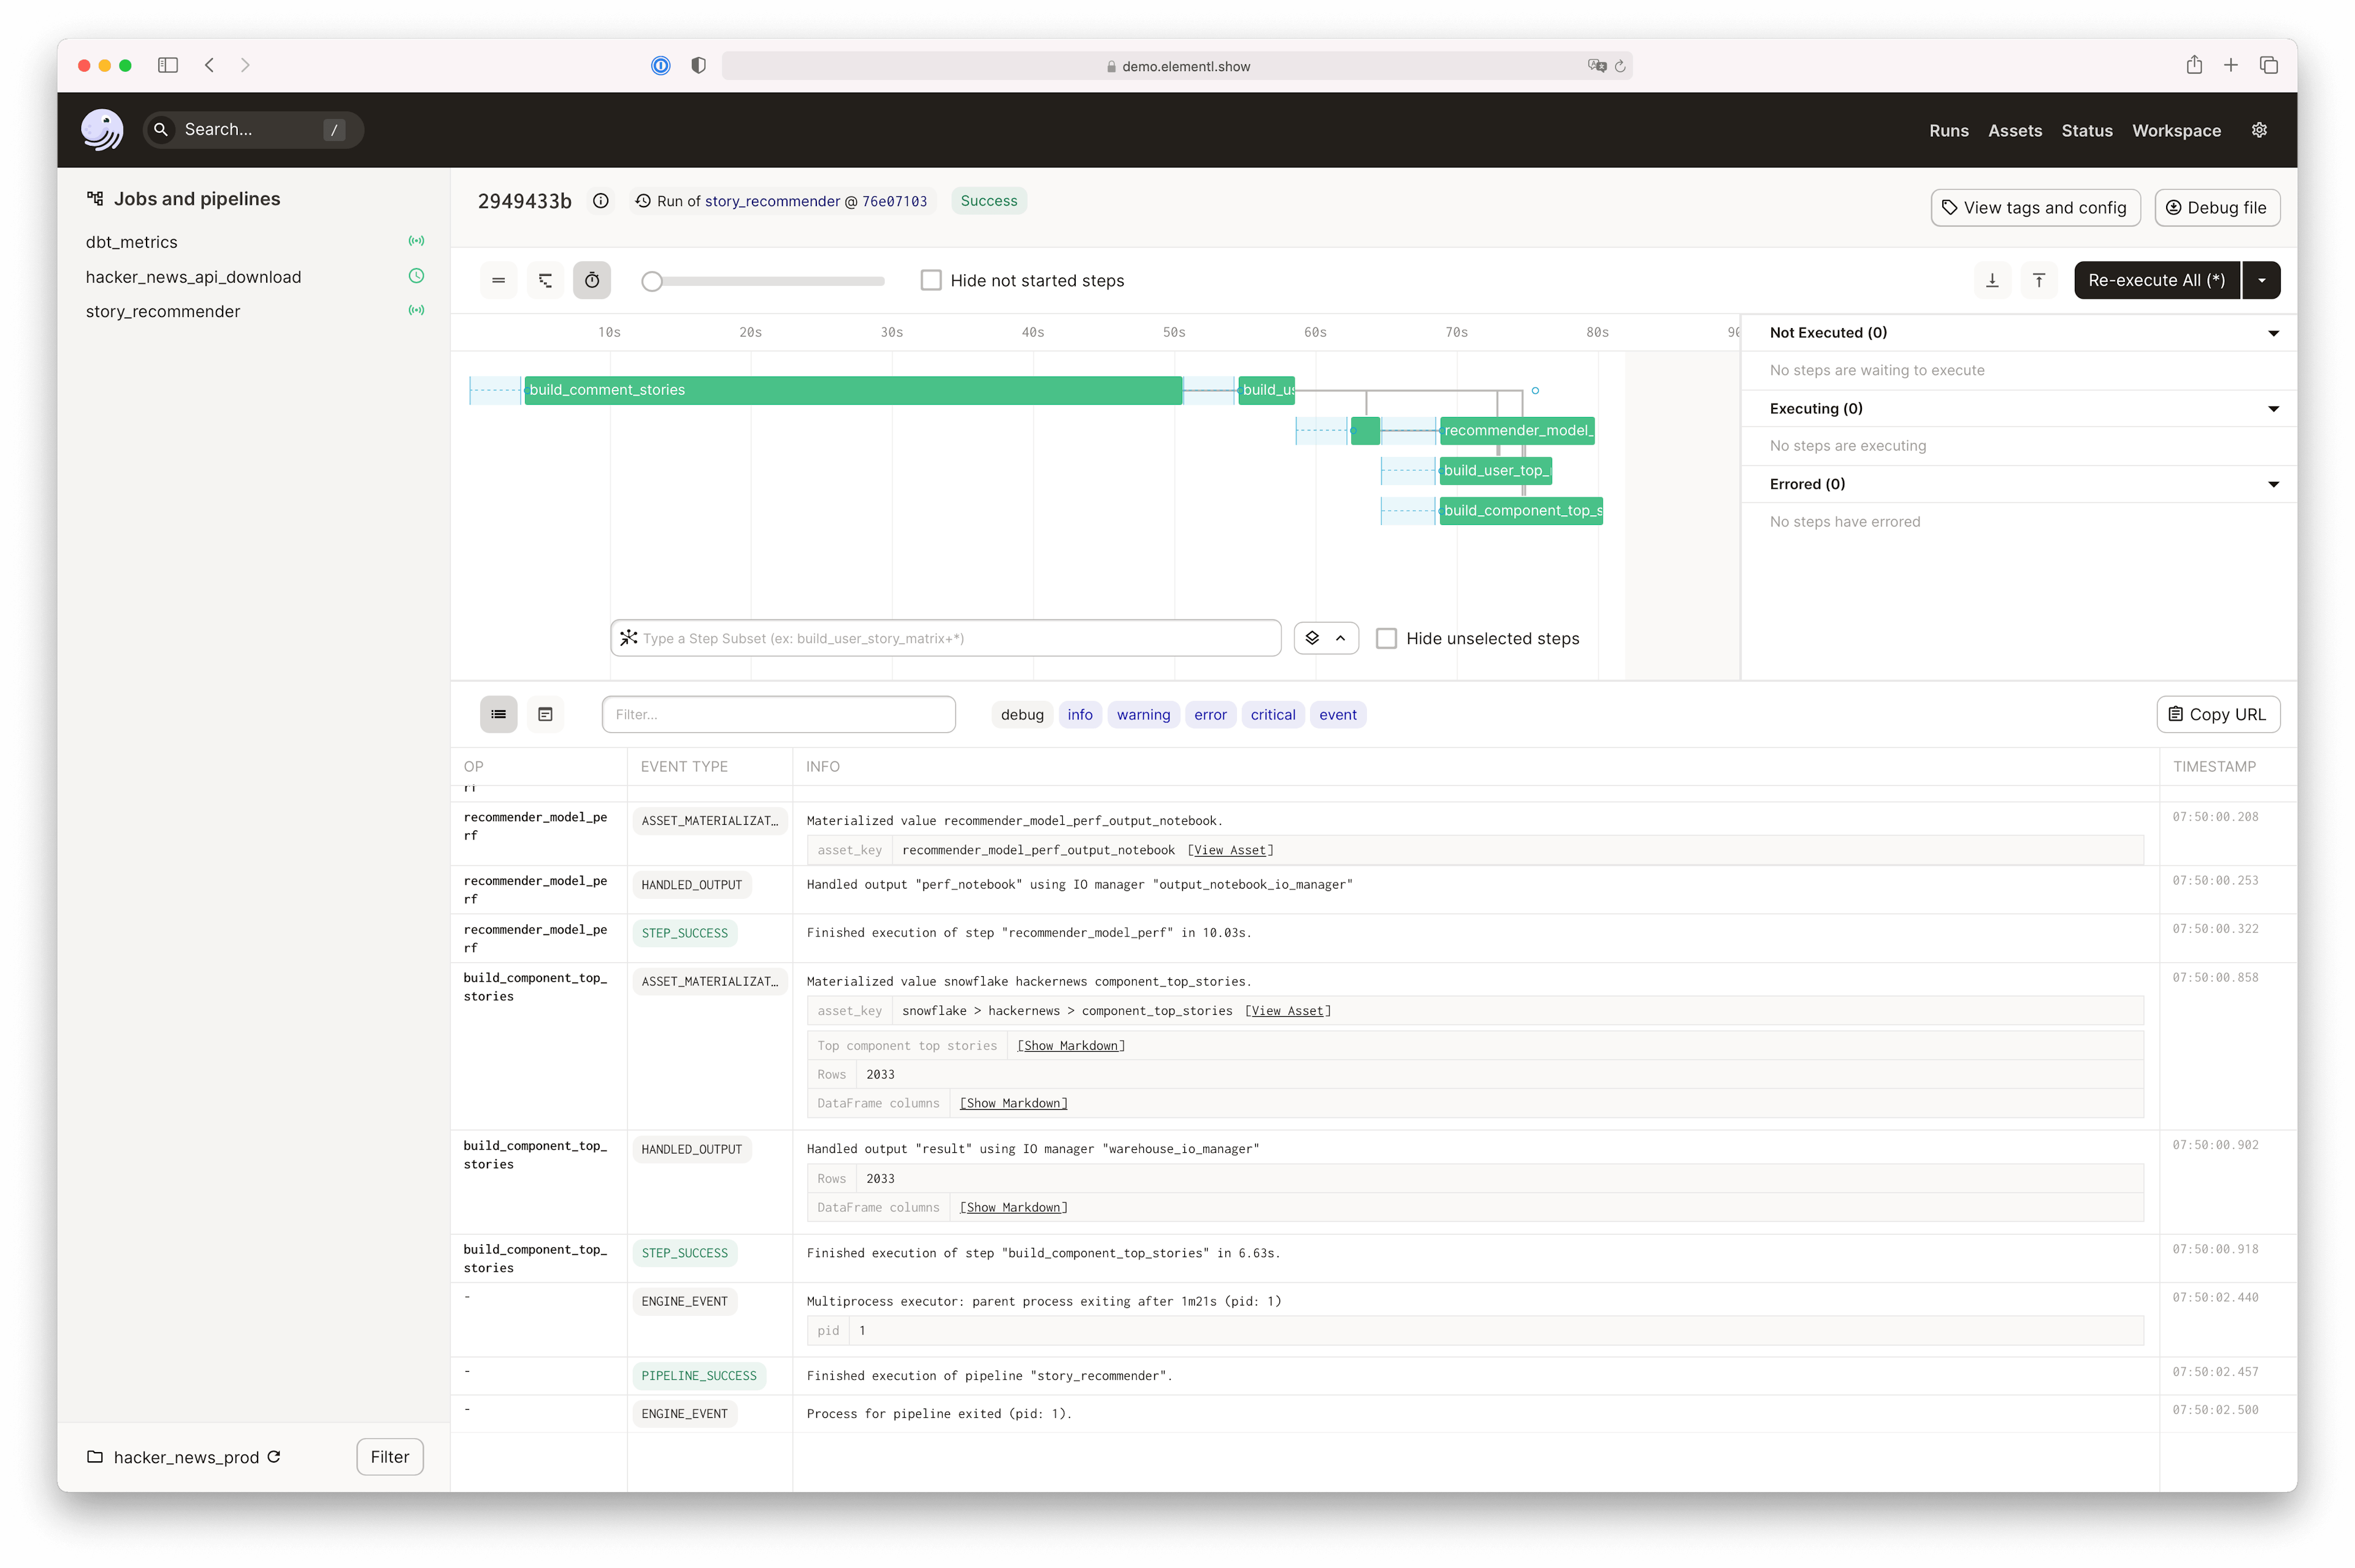
Viewing a single run#
The Run page provides details for a single run, including timing information, errors, and logs.
The upper left pane contains a Gantt chart, indicating how long each op took to execute. The bottom pane displays filterable events and logs emitted during the course of execution.
Re-executing a run#
The Run page also allows you to re-execute a run with the same configuration. Click the "Re-execution" dropdown button. There are several re-execution options:
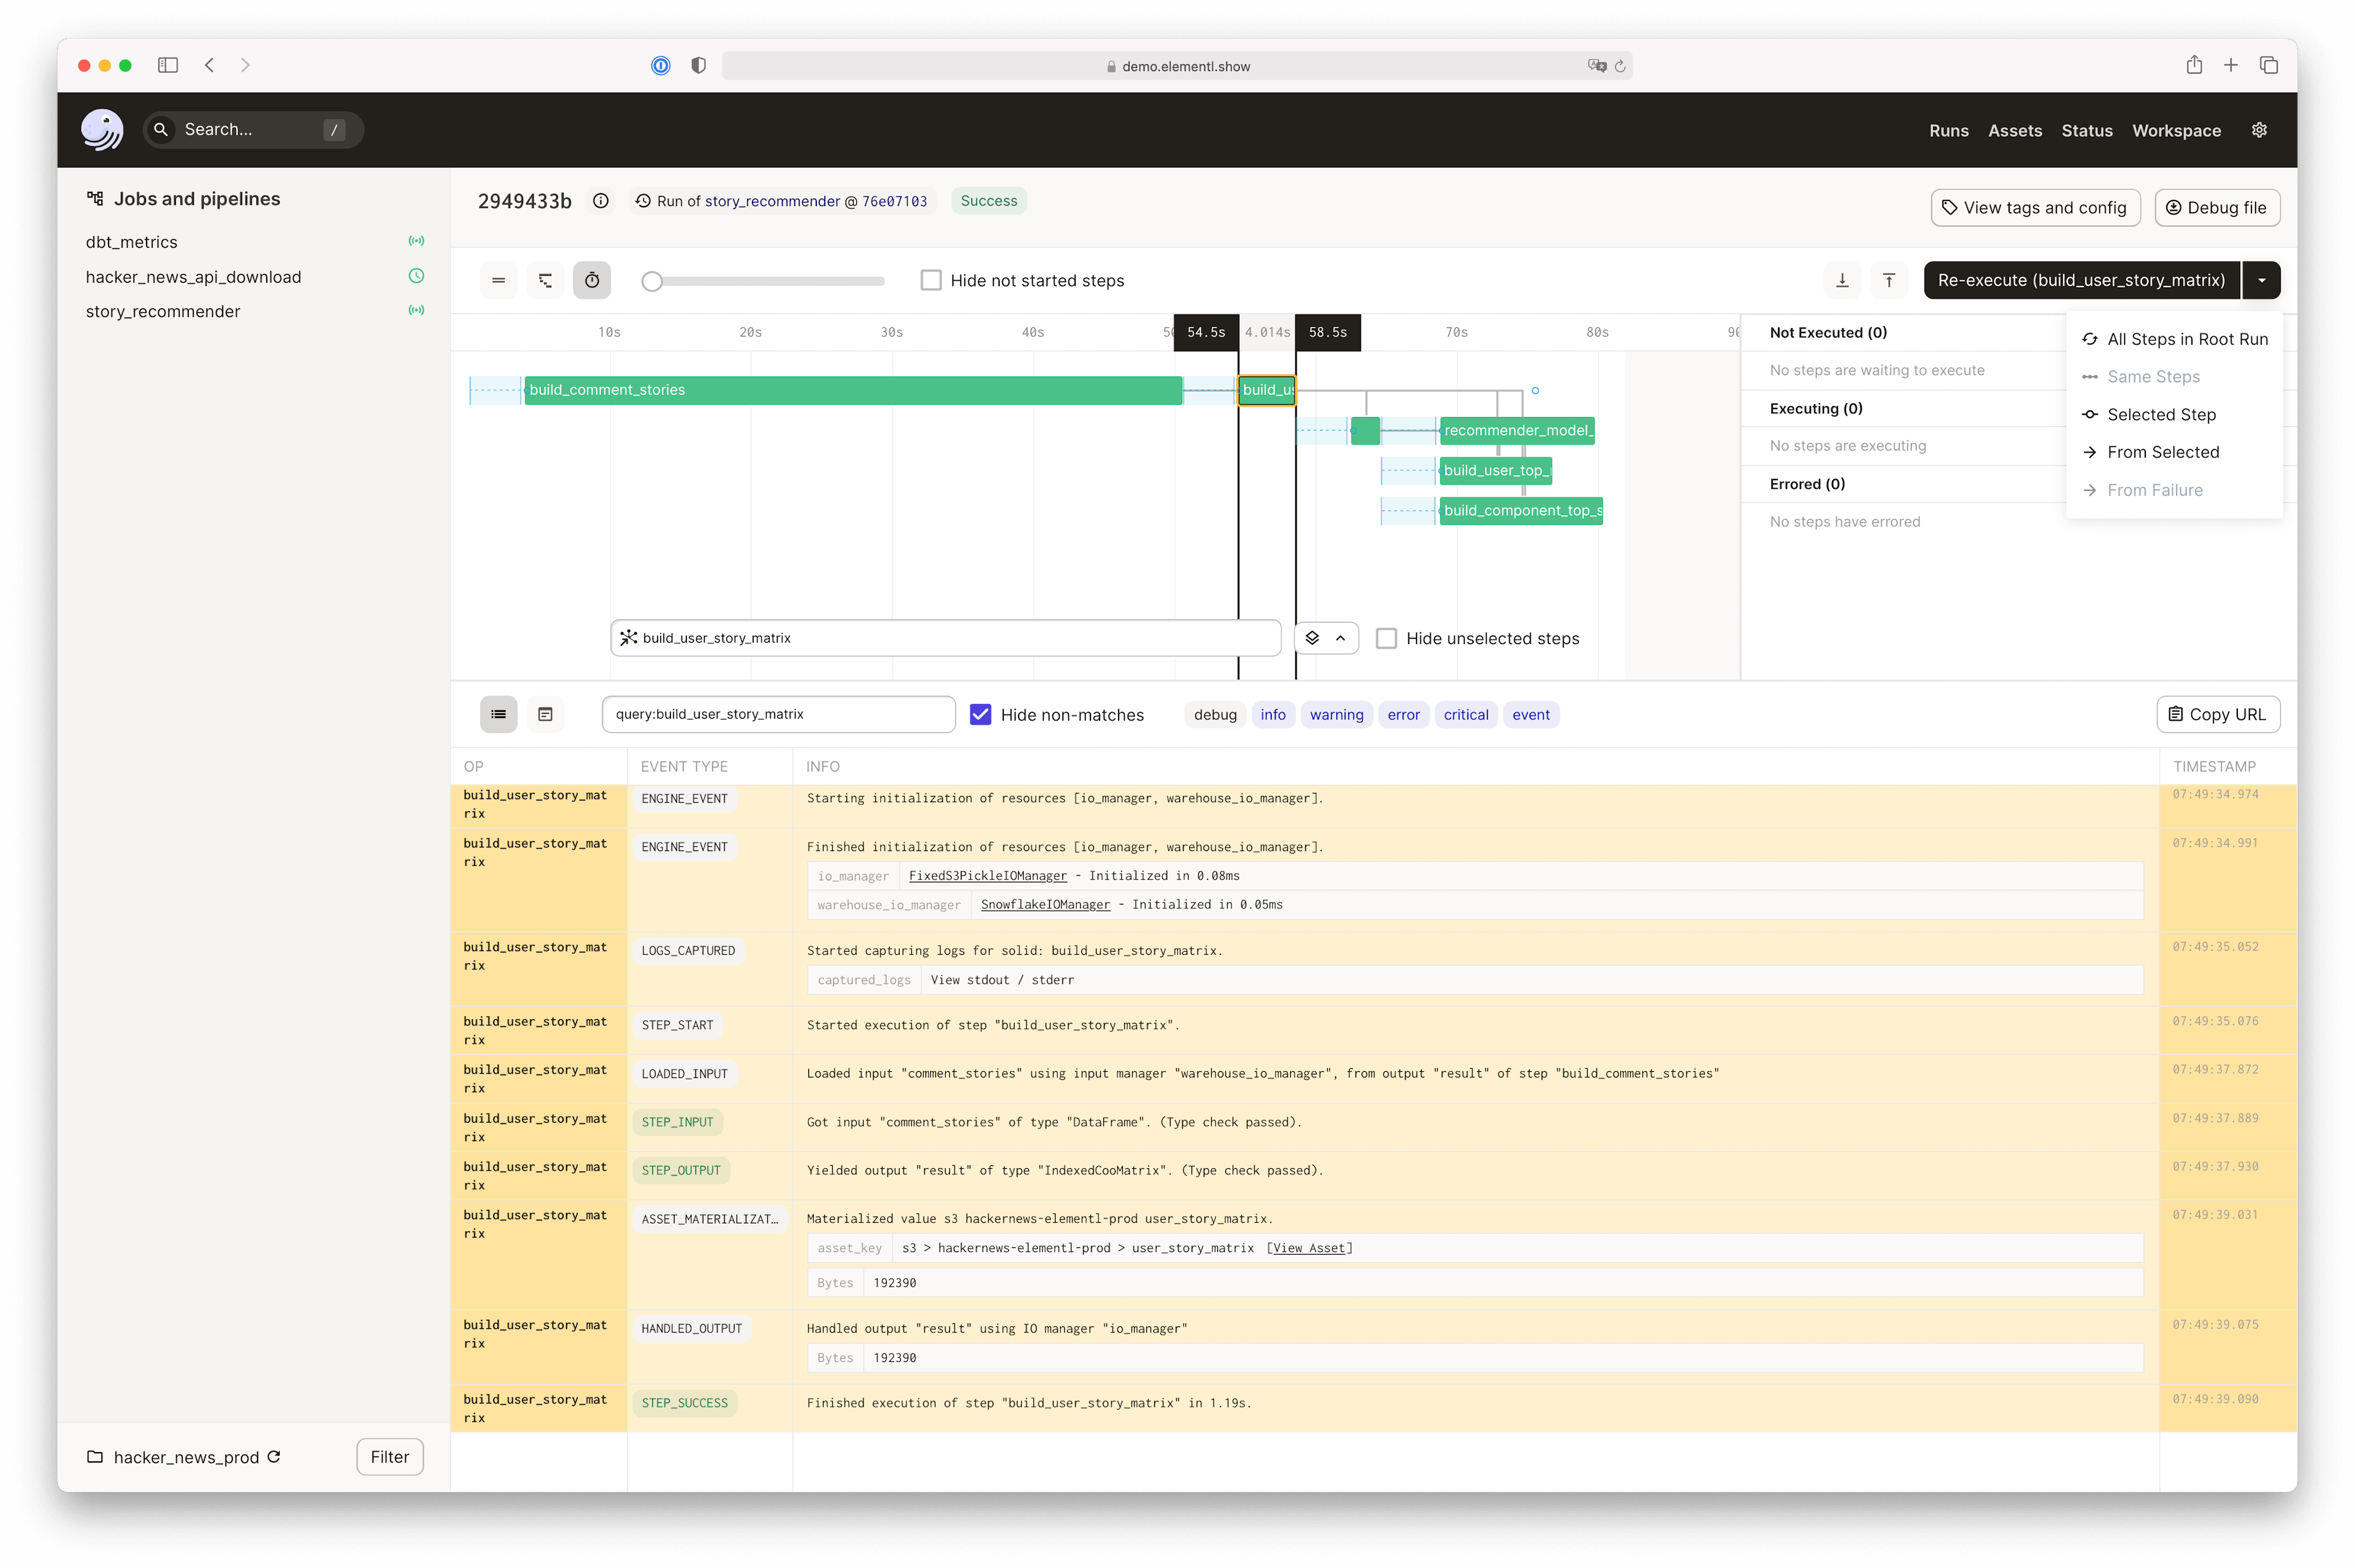
- All Steps: Re-execute the run from scratch.
- Selected Steps: Re-execute the selected steps.
- From Selected: Re-execute the steps downstream from the selected steps
- From Failure: Retry the run, skipping steps completed successfully. This is only enabled when the run has failed.
Related runs (e.g., runs created by re-executing the same previous run) are now grouped together in the right pane for easy reference.
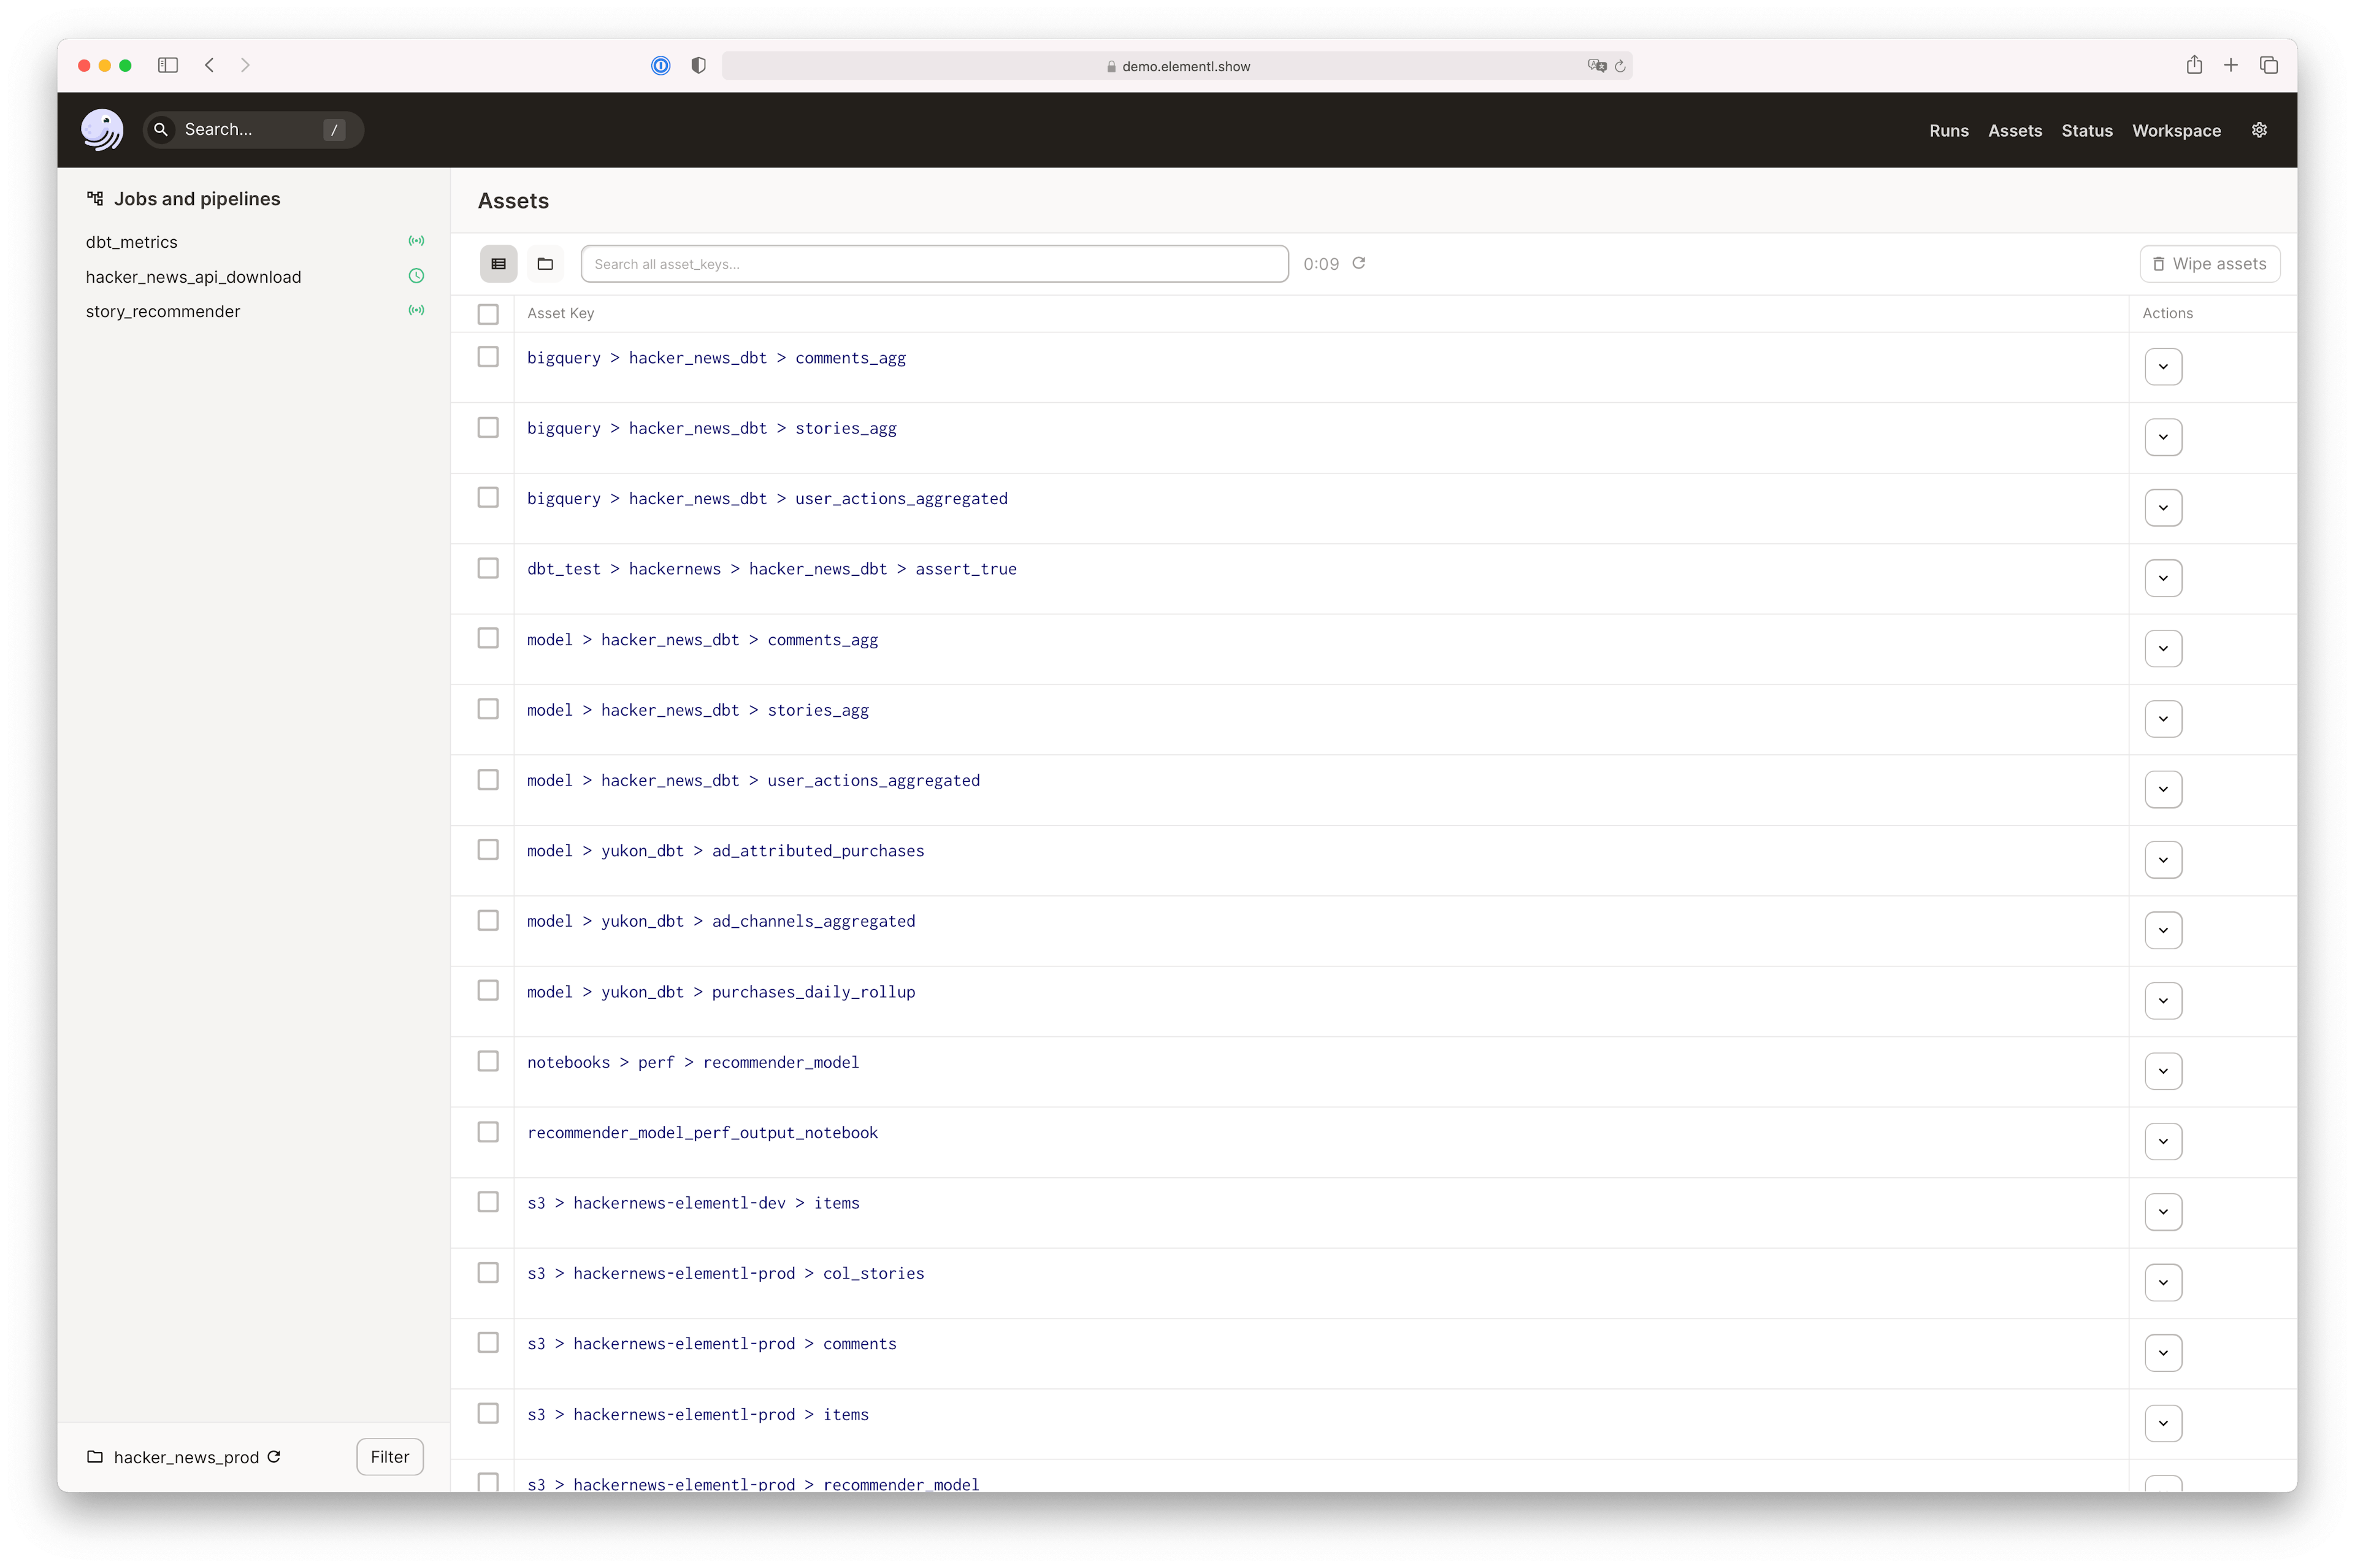
Assets#
The Assets page lists all assets. You can filter the list by asset key.
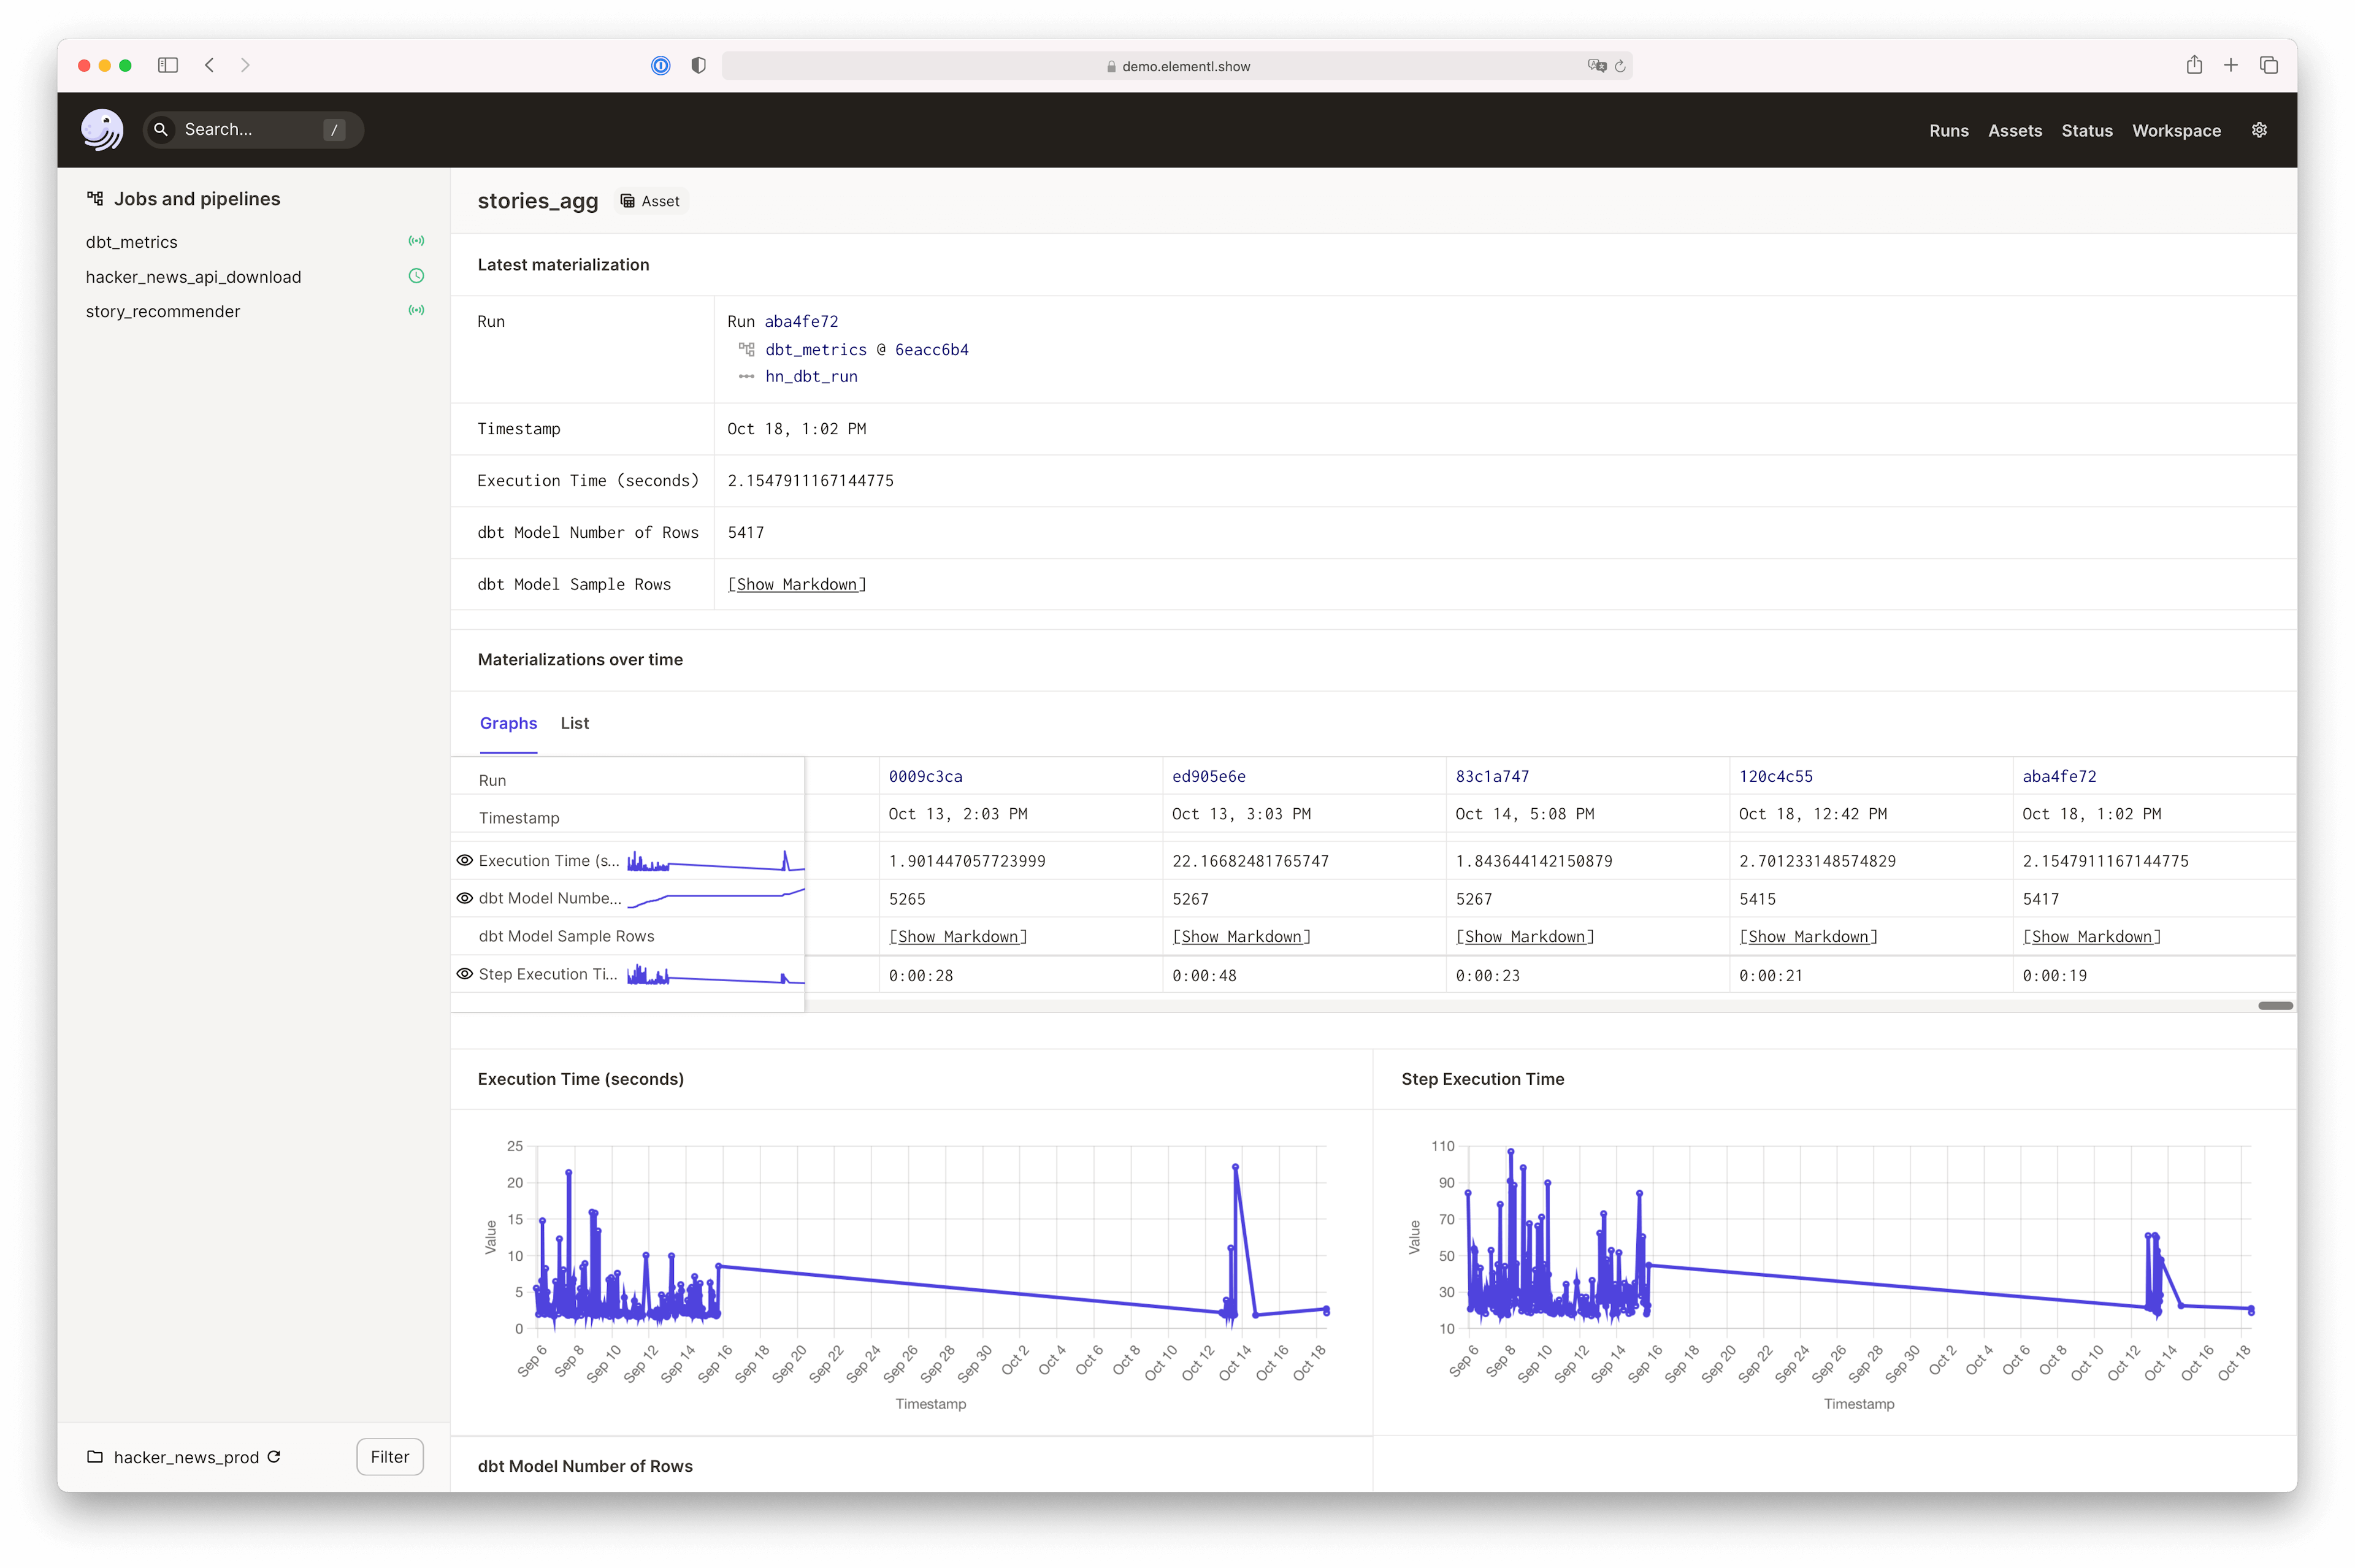
Asset Details#
The Asset page lists details about a single asset.
Schedules and Sensors#
Schedules#
The Schedules page lists all schedules defined in your workspace, as well as information about upcoming ticks for anticipated scheduled runs.
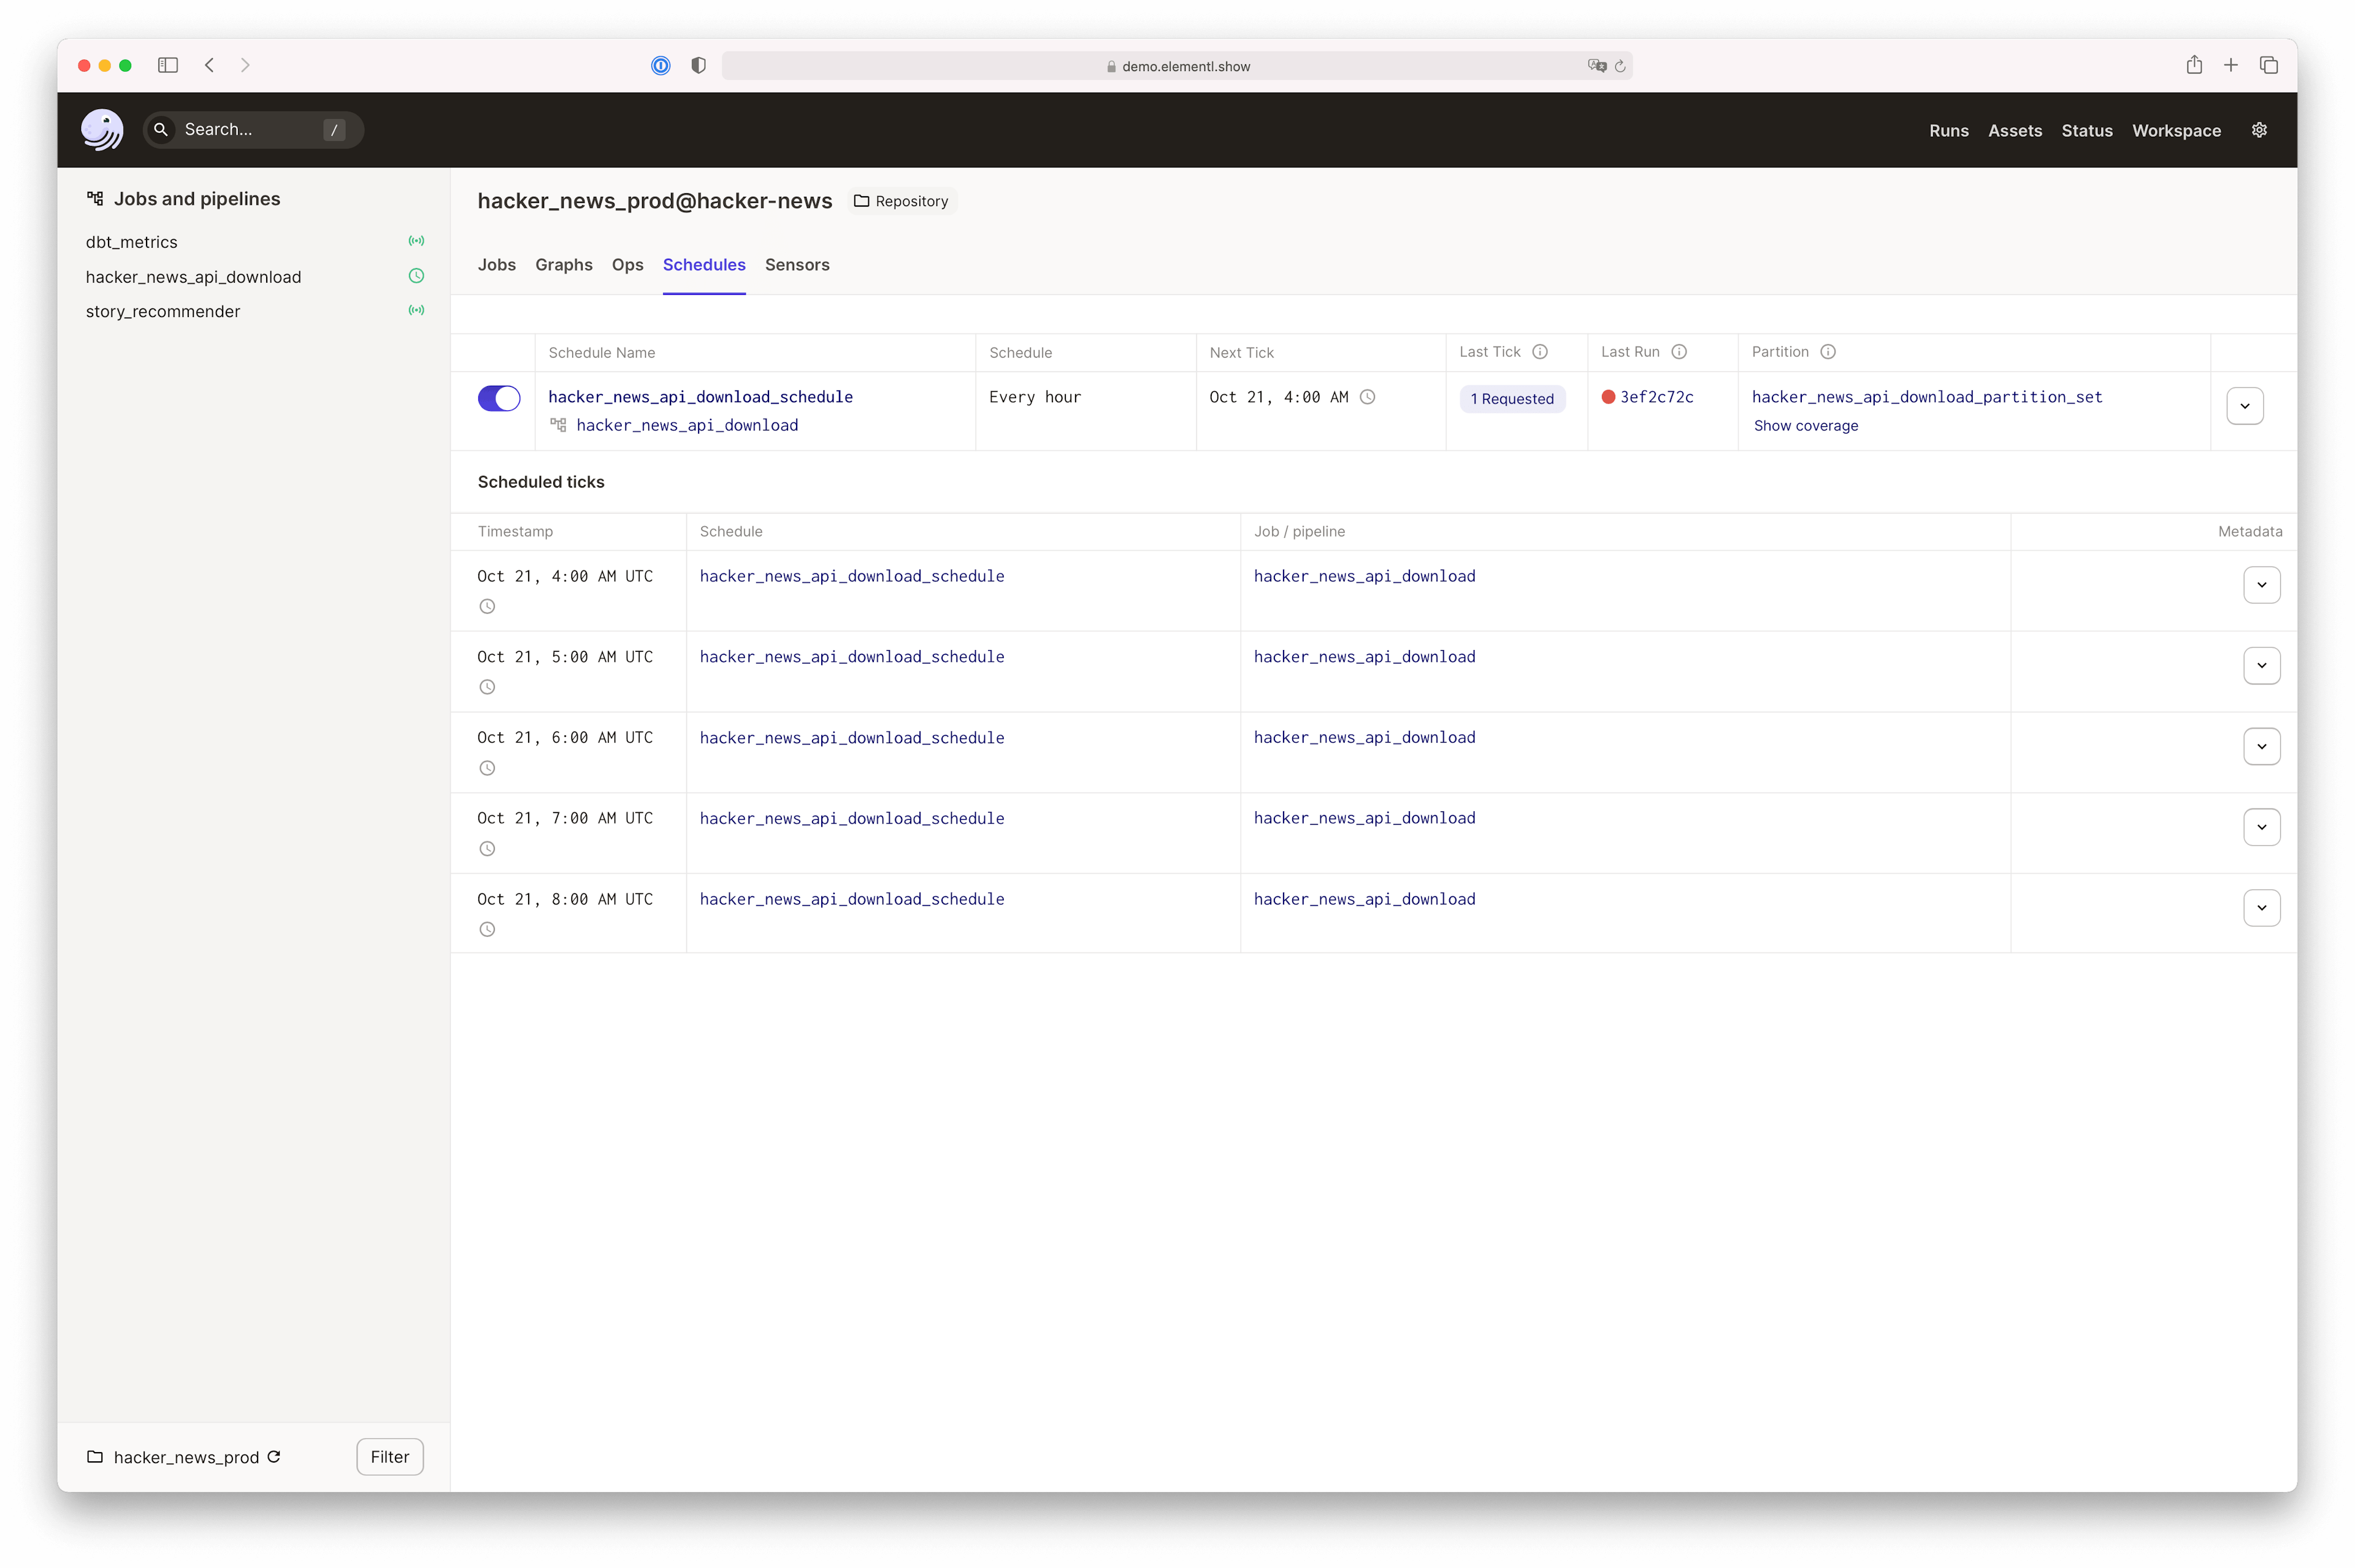
Clicking each schedule, you can find details about a single schedule, its recent tick history, and recent runs.
Sensors#
The Sensors page lists all sensors defined in your workspace, as well as information about the sensor's frequency and its last tick.
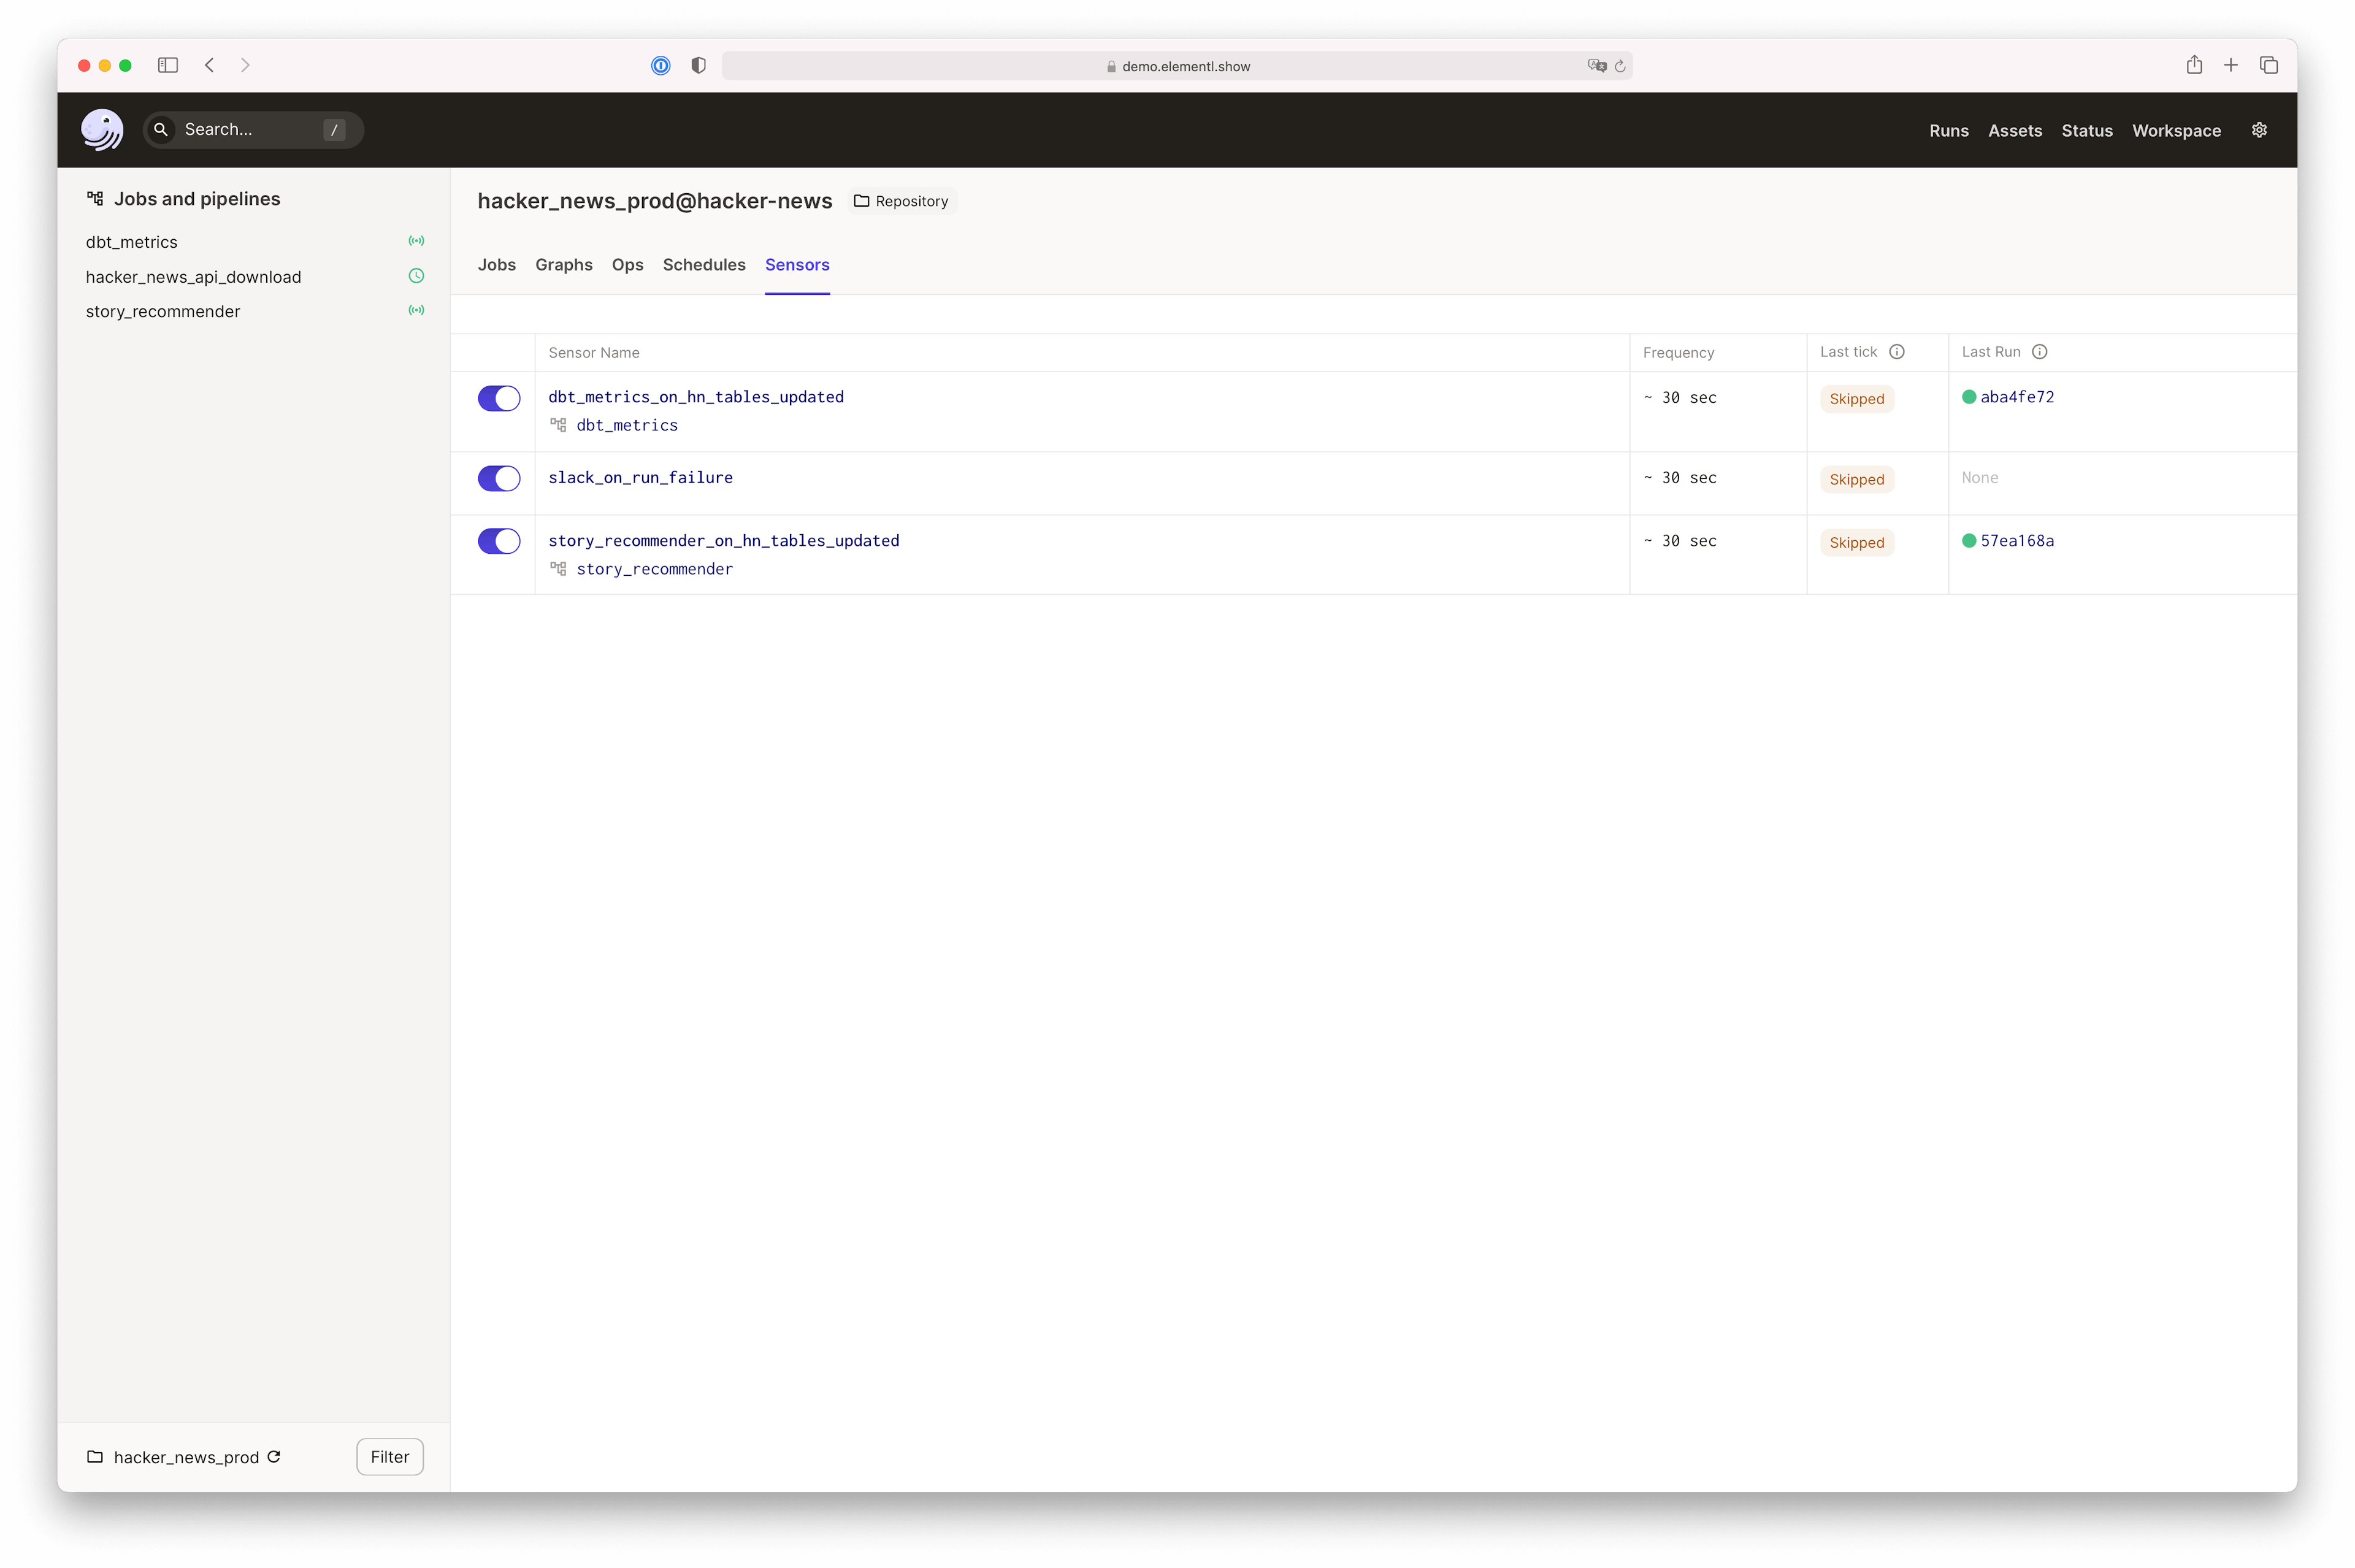
Clicking each sensor, you can find details about a single sensor, its recent tick history, and recent runs.
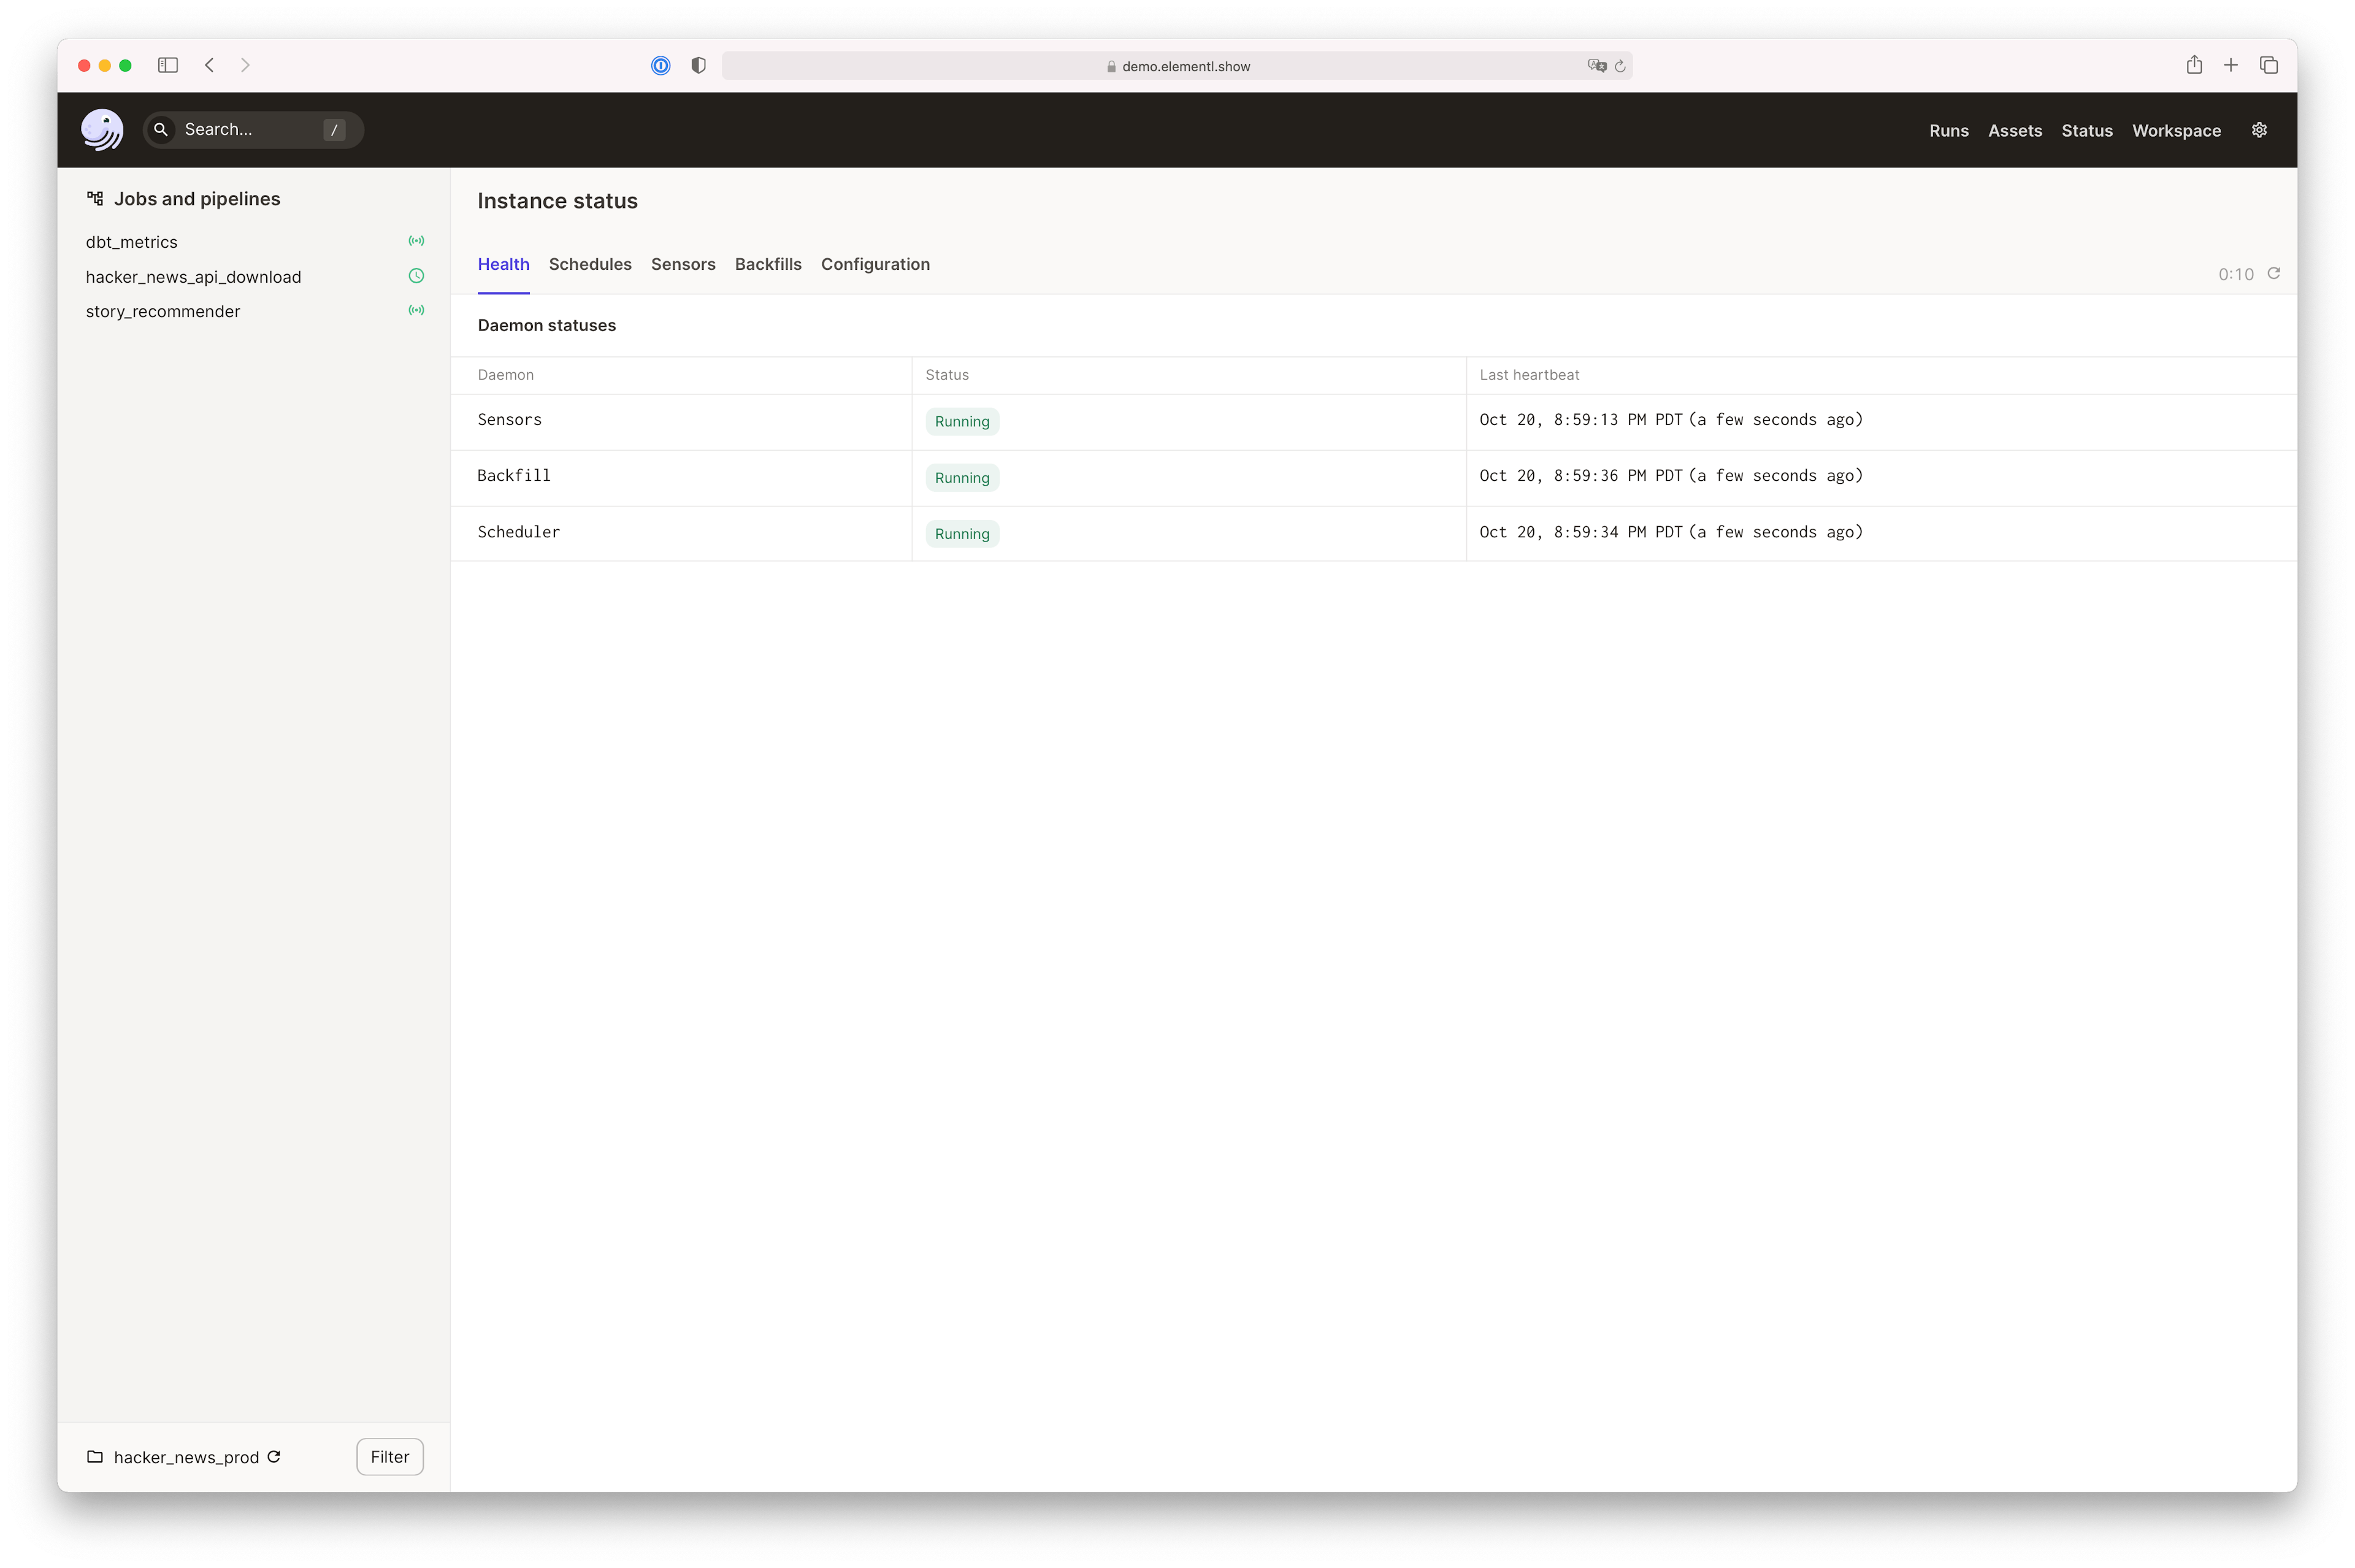
Instance Status#
The Instance status page includes information about the status of the repositories in your workspace, daemon health, schedules, sensors, and configuration details.